Abstract
The yield of roots and tubers of agricultural crops is one of the important indicators in global agriculture. According to the latest data for 2022, New Zealand boasts the largest yield, recording 45.7 tons per hectare. In light of this data, New Zealand agriculture shows high efficiency and technological capabilities in the production of roots and tubers. On the other hand, other countries are also actively engaged in agricultural production, and there are differences in production volume, especially depending on climatic conditions and land suitability. In addition, advances in agricultural technology and sustainable agricultural efforts are progressing in each country, which contributes to improved production volume and quality. Considering the trends over the past few years, the pursuit of improved productivity and sustainability in agriculture has become a global trend, and as a result, each country is focusing on technological innovation and efficiency. In the future, it is important for countries around the world to continue their efforts to optimize agricultural production, taking into account the effects of climate change and increasing food demand.
Rhizome and tuber production (Worldwide)
Considering data on root and tuber production from 1961 to 2022, agricultural transitions and global factors become clear. Switzerland’s record peak in 1996 indicates the sophistication of agricultural techniques and management at that time. However, the subsequent decline in production from the peak to 74.5% is likely the result of a combination of factors. Climate change, changes in agricultural policies, and a slow pace of technological innovation are some of the reasons. On the other hand, it would be interesting to see what trends are observed in other countries and regions. It should also be taken into account that each region has its own unique climatic conditions and land use patterns, which have a significant impact on root and tuber production. In addition, with the increasing importance of sustainable agriculture, the challenge is to increase production and ensure quality. Through such data, we can understand agriculture’s past successes and current challenges, and obtain valuable suggestions for considering future directions.
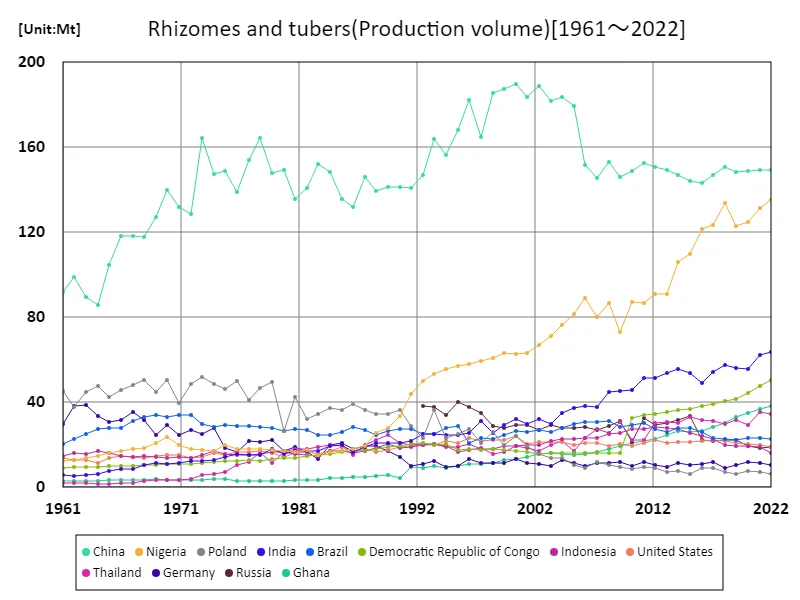
The maximum is 190Mt[2000] of China, and the current value is about 78.7%
Rootstock and tuber yields (latest year, world)
Looking at the data on the production of agricultural roots and tubers in 2022, New Zealand recorded the largest production. New Zealand’s high productivity of 45.7t/ha suggests the country’s advanced agricultural technology and management. Meanwhile, the overall average is 17.7t/ha, highlighting the differences in productivity between individual countries and regions. Through this data, the importance of roots and tubers in global agricultural production is shown. These parts are used as ingredients for many foods and feeds and are essential for food security. In addition, the increase or decrease in this production is affected by various factors, such as climatic conditions and changes in agricultural policies. From the perspective of sustainable agriculture, it is important not only to increase production volume, but also to improve quality and reduce the burden on the environment. Global agriculture is pursuing the stability and sustainability of food production while addressing these challenges.
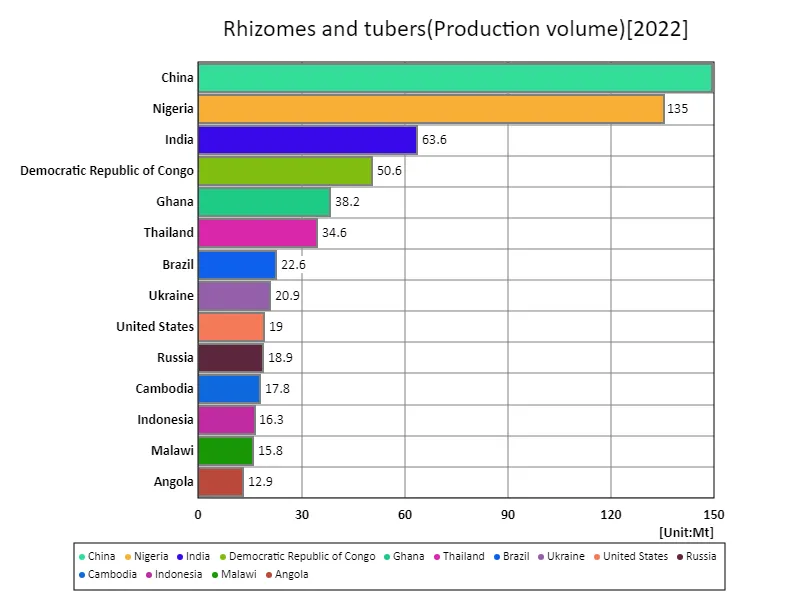
The maximum is 150Mt of China, the average is 4.63Mt, and the total is 893Mt
Rhizome and tuber production (continental)
Looking at the data on the production of agricultural crop roots and tubers in 2022, North America recorded the largest production. This data reflects the high efficiency and technological capabilities of agricultural production in North America. North American agriculture has achieved high productivity through large-scale agricultural management and the introduction of advanced technologies. On the other hand, as is clear from comparisons with other regions, there are regional differences in agricultural production around the world. Climatic conditions, land availability, agricultural policies, etc. affect production volume. In addition, from the perspective of sustainability, not only an increase in production volume but also improvement of quality and consideration of the environment are required. Agricultural crop roots and tubers are an important part of many foods and feeds, and the stability of their production is essential for food security. In the future, it is expected that global agricultural production will evolve into a more efficient and environmentally friendly form through the promotion of sustainable agriculture and the advancement of technological innovation.
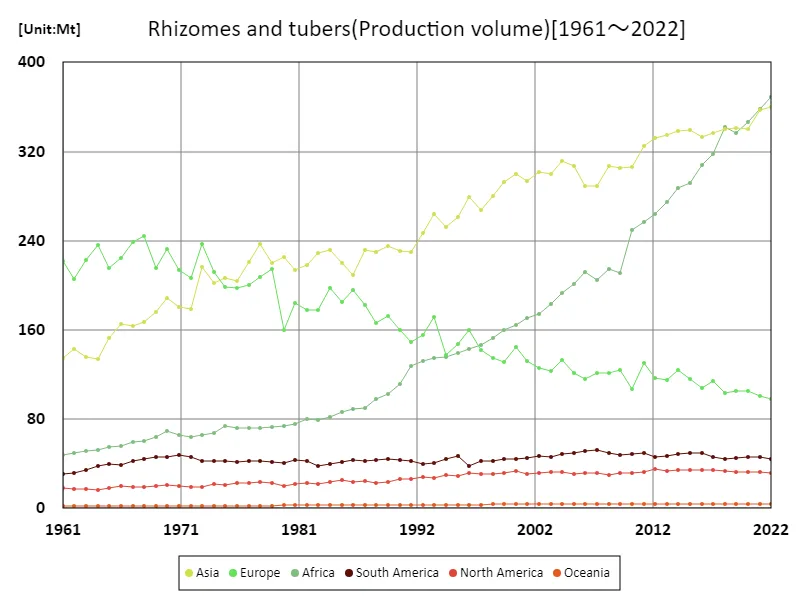
The maximum is the latest one, 368Mt of Africa
Root and tuber yields (latest year, continental)
Looking at the data on the production of crop roots and tubers in 2022, North America recorded the largest production. This data shows the high efficiency and technological capabilities of agricultural production in North America. North American agriculture has achieved high productivity through large-scale agricultural management and the introduction of advanced technologies. On the other hand, the overall average of 17.8t/ha shows that North American productivity is significantly higher than other regions. This difference is caused by various factors, including climatic conditions, differences in land use, and differences in agricultural policies. Crop roots and tubers are an important part of many foods and feeds, and the stability of their production is essential for food security. From the perspective of sustainable agriculture, it is becoming increasingly important not only to increase production volume but also to improve quality and take the environment into consideration. Global agriculture is pursuing the stability and sustainability of food production while addressing these challenges.
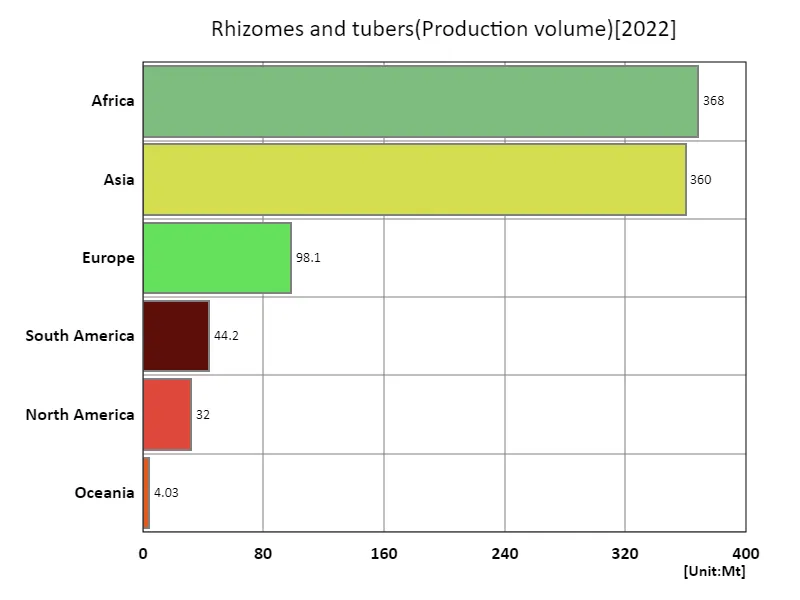
The maximum is 368Mt of Africa, the average is 151Mt, and the total is 907Mt
Main data
| Production(Rhizomes and tubers, Production volume, t) [Mt] | ||||||||||
|---|---|---|---|---|---|---|---|---|---|---|
| World | Lower-middle-income countries | Africa | Asia | Upper-middle-income countries | Net Food Importing Developing Countries | Western Africa | Least Developed Countries | Low Income Food Deficit Countries | Eastern Asia | |
| 2022 | 906.85 | 423.39 | 368.5 | 360.04 | 287.7 | 240.99 | 208.96 | 192.81 | 159.87 | 154.94 |
| 2021 | 899.92 | 411.25 | 358.36 | 357.42 | 291.94 | 230.95 | 204.31 | 184.87 | 154.88 | 154.89 |
| 2020 | 874.09 | 391.28 | 346.45 | 339.98 | 287.95 | 221.12 | 194.26 | 176.06 | 150.17 | 154.66 |
| 2019 | 864.98 | 385.02 | 336.42 | 340.86 | 291.18 | 214.39 | 187.67 | 170.49 | 146.68 | 154.32 |
| 2018 | 868 | 393.12 | 341.53 | 340.6 | 290.56 | 210.82 | 194.84 | 168.15 | 144.41 | 156.17 |
| 2017 | 852.29 | 370.67 | 317.7 | 336.78 | 292.07 | 197.66 | 182.34 | 157.74 | 133.24 | 152.47 |
| 2016 | 835.92 | 359.46 | 307.6 | 332.68 | 294.92 | 192.74 | 177.42 | 154.39 | 130.6 | 149.17 |
| 2015 | 835.09 | 348.67 | 291.42 | 339.64 | 310.14 | 188.1 | 163.69 | 147.93 | 128.35 | 150.67 |
| 2014 | 836.03 | 342.85 | 286.83 | 338.06 | 308.89 | 182.83 | 160.45 | 146.55 | 128.96 | 153.59 |
| 2013 | 809.36 | 321.86 | 274.77 | 334.39 | 309.39 | 183.58 | 140.31 | 148.44 | 128.42 | 156.77 |
| 2012 | 797.87 | 309.47 | 263.81 | 331.92 | 310.83 | 173.02 | 137.8 | 137.78 | 125.21 | 157.71 |
| 2011 | 798.31 | 307.21 | 256.86 | 324.85 | 310.14 | 171.85 | 132.18 | 138.19 | 119.49 | 159.65 |
| 2010 | 746.79 | 283.87 | 249.33 | 306.09 | 293.2 | 160.56 | 130.63 | 128.52 | 114.43 | 155.47 |
| 2009 | 723.39 | 260.9 | 211.27 | 305.04 | 305.75 | 134.38 | 114.67 | 103.08 | 93.72 | 153.08 |
| 2008 | 727.83 | 270.3 | 214.97 | 307.41 | 307.6 | 126.56 | 126.8 | 94.71 | 87.29 | 160.29 |
| 2007 | 702.73 | 243.11 | 204.85 | 288.63 | 301.12 | 122.25 | 115.65 | 93.27 | 87.74 | 153.22 |
| 2006 | 703.64 | 250.14 | 211.84 | 288.65 | 302.83 | 119.86 | 123.02 | 91.94 | 87.43 | 159.12 |
| 2005 | 714.45 | 239.5 | 201.48 | 307.17 | 321.82 | 115.89 | 114.79 | 87.2 | 84.58 | 187.16 |
| 2004 | 722.55 | 226.24 | 193.34 | 311.13 | 331.33 | 112.19 | 110.19 | 86.18 | 83.17 | 191.31 |
| 2003 | 687.96 | 207.17 | 182.91 | 299.48 | 324.53 | 105.69 | 105.35 | 80.51 | 79.44 | 189.11 |
| 2002 | 684.46 | 201.58 | 173.98 | 302.06 | 323.53 | 100.87 | 99.28 | 76.77 | 76.26 | 196.89 |
| 2001 | 675.57 | 189.11 | 170.47 | 293.98 | 320.91 | 102.27 | 92.8 | 78.84 | 79.74 | 191.85 |
| 2000 | 689.79 | 188.69 | 164.69 | 299.76 | 325.21 | 97.9 | 90.93 | 75.01 | 76.19 | 197.63 |
| 1999 | 663.09 | 177.16 | 160.3 | 292.69 | 319.02 | 93.04 | 90.42 | 69.83 | 72.57 | 195.19 |
| 1998 | 643.91 | 168.11 | 152.5 | 279.81 | 312.21 | 86.46 | 86.21 | 65.15 | 67.8 | 192.83 |
| 1997 | 630.95 | 171.98 | 146.18 | 267.21 | 298.94 | 81.68 | 83.65 | 61.42 | 64.19 | 172.1 |
| 1996 | 656.03 | 165.59 | 142.69 | 279.51 | 320.65 | 79.57 | 80.4 | 59.26 | 61.14 | 188.55 |
| 1995 | 627.03 | 158.1 | 138.93 | 261.57 | 313.27 | 77.47 | 78.17 | 58.01 | 59.46 | 174.87 |
| 1994 | 603.22 | 155.99 | 136.07 | 252.56 | 293.46 | 76.85 | 75.2 | 59.9 | 61.37 | 163.07 |
| 1993 | 641.27 | 158.97 | 134.73 | 263.82 | 308.02 | 76.34 | 73.51 | 59.9 | 61.35 | 170.43 |
| 1992 | 605.09 | 154.18 | 132.27 | 247.04 | 289.26 | 77.69 | 69.36 | 61.68 | 63.35 | 154.73 |
| 1991 | 578.92 | 123.08 | 127.8 | 230.29 | 300.04 | 78.74 | 63.51 | 61.94 | 63.58 | 147.97 |
| 1990 | 574.11 | 105.42 | 111.29 | 230.58 | 300.38 | 77.63 | 47.66 | 61.77 | 63.63 | 148.91 |
| 1989 | 581.22 | 98.97 | 102.93 | 235.31 | 315.16 | 74.54 | 42.84 | 58.29 | 59.49 | 149.3 |
| 1988 | 562.52 | 95.26 | 98.14 | 229.71 | 298.64 | 73.76 | 39.7 | 57.35 | 57.97 | 147.45 |
| 1987 | 573.58 | 86.75 | 89.82 | 231.36 | 313.88 | 70.82 | 32.51 | 55.26 | 56.4 | 154.37 |
| 1986 | 564.19 | 83.77 | 89.13 | 209.6 | 307.27 | 71.43 | 31.46 | 56.29 | 57.72 | 140.58 |
| 1985 | 561.31 | 84.34 | 86 | 220.01 | 298.84 | 70.11 | 29.37 | 54.94 | 56.26 | 143.87 |
| 1984 | 578.27 | 80.87 | 82.02 | 232 | 323.2 | 67.18 | 29.13 | 53.1 | 53.52 | 156.26 |
| 1983 | 549.63 | 74.76 | 79.6 | 229.32 | 319.04 | 66.96 | 25.96 | 53.04 | 54.08 | 160.09 |
| 1982 | 543.82 | 77.25 | 79.94 | 218.21 | 305.58 | 64.96 | 28.46 | 50.96 | 52.02 | 149.15 |
| 1981 | 540.86 | 75.29 | 75.84 | 213.7 | 295.62 | 61.88 | 27.46 | 48.28 | 48.89 | 143.35 |
| 1980 | 522.52 | 73.49 | 73.52 | 225.83 | 299.52 | 59.03 | 27.65 | 45.78 | 46.28 | 157.32 |
| 1979 | 575.01 | 75.86 | 73 | 220.35 | 319.59 | 58.14 | 28.04 | 45.03 | 45.81 | 155.93 |
| 1978 | 585.72 | 72.2 | 72.41 | 237.39 | 335.49 | 56.99 | 28.6 | 44.48 | 45.05 | 172.29 |
| 1977 | 561.12 | 69.59 | 72.43 | 220.78 | 318.09 | 56.59 | 27.74 | 44.54 | 45.39 | 162.45 |
| 1976 | 539.96 | 69.21 | 72.05 | 203.41 | 301.51 | 56.02 | 28.47 | 44.03 | 44.79 | 147.48 |
| 1975 | 544.49 | 68.32 | 73.91 | 206.49 | 310.8 | 55.22 | 30.32 | 43.39 | 44.35 | 157.22 |
| 1974 | 548.55 | 61.99 | 67.96 | 202.44 | 302.51 | 51.29 | 27.7 | 40.06 | 41.04 | 154.94 |
| 1973 | 583.38 | 60.15 | 65.76 | 216.62 | 344.6 | 49.2 | 27.71 | 38.37 | 38.83 | 172.75 |
| 1972 | 516.14 | 58.5 | 64.11 | 178.56 | 279.74 | 47.4 | 27.14 | 37.34 | 37.73 | 138.01 |
| 1971 | 529.29 | 59.41 | 65.37 | 180.64 | 297.87 | 47.11 | 29.54 | 36.98 | 36.87 | 141.34 |
| 1970 | 559.61 | 62.47 | 69.38 | 188.22 | 308.62 | 47.09 | 33.24 | 37.07 | 36.98 | 150.01 |
| 1969 | 524.56 | 59.84 | 63.63 | 176.48 | 291.31 | 44.3 | 30.45 | 34.48 | 34.18 | 137.59 |
| 1968 | 537.32 | 56.4 | 60.26 | 166.91 | 291.49 | 42.45 | 27.96 | 33.35 | 33.44 | 129.22 |
| 1967 | 525.16 | 53.29 | 59.07 | 163.58 | 281.19 | 41.82 | 27.44 | 32.77 | 32.99 | 129.44 |
| 1966 | 506.44 | 50.64 | 55.98 | 165.42 | 270.87 | 39.77 | 25.84 | 30.99 | 31.38 | 131.37 |
| 1965 | 484 | 48.38 | 55.2 | 152.92 | 257.02 | 40.03 | 24.47 | 31.22 | 31.75 | 118.5 |
| 1964 | 478.57 | 45.06 | 52.39 | 134.09 | 246.78 | 38.23 | 23.03 | 29.68 | 30.42 | 100.19 |
| 1963 | 463.43 | 43.73 | 51.41 | 135.31 | 224.45 | 37.47 | 22 | 29.45 | 30.34 | 102.93 |
| 1962 | 448.86 | 40.86 | 49.58 | 142.98 | 225.93 | 36.99 | 20.67 | 29.18 | 30 | 111.65 |
| 1961 | 455.31 | 40.52 | 48.02 | 135.07 | 230.45 | 36.01 | 19.96 | 28.48 | 29.24 | 104.97 |
Comments