
Abstract
The data on global sweet potato production is interesting. The latest data from 2022 shows that Australia has achieved an astounding production of 39.7 tons per hectare. This figure shows that Australia is the world leader in sweet potato production. The success of Australian sweet potato production is largely due to its adaptability to climatic conditions and the introduction of advanced agricultural techniques. Compared to other countries, Asian countries such as Japan and China also boast high production volumes, but there are fluctuations depending on the agricultural policies and land use characteristics of each country. In Japan in particular, sweet potatoes are an important agricultural product rooted in traditional food culture, and the skills and passion of farmers are reflected in the production volume. On the other hand, in China, the large population and regional diversity create regional differences in production volume. In general, it can be said that sweet potato production is thriving all over the world, and different trends are seen depending on the characteristics and conditions of each region.
Sweet potato production (worldwide)
Analyzing sweet potato production data over the past 60 years reveals some interesting trends. Between 1961 and 2022, global sweet potato production has fluctuated. Of particular note is Australia’s astounding record of 40.9 tonnes/hectare in 2017. Given this peak record, it suggests that the current 96.9% production is still at a high level. On the other hand, looking at past trends, there are year-to-year fluctuations in production, which is mainly due to factors such as climatic conditions, developments in agricultural technology, and changes in market demand. Countries like Australia have improved production by innovating agricultural technology and adopting sustainable agricultural practices. Meanwhile, weather effects and economic factors have affected production in other regions. Sweet potato production varies by region, but it is gaining importance around the world due to growing demand and changing food culture. Going forward, the spread of sustainable agricultural practices and responding to climate change will be important topics in sweet potato production.
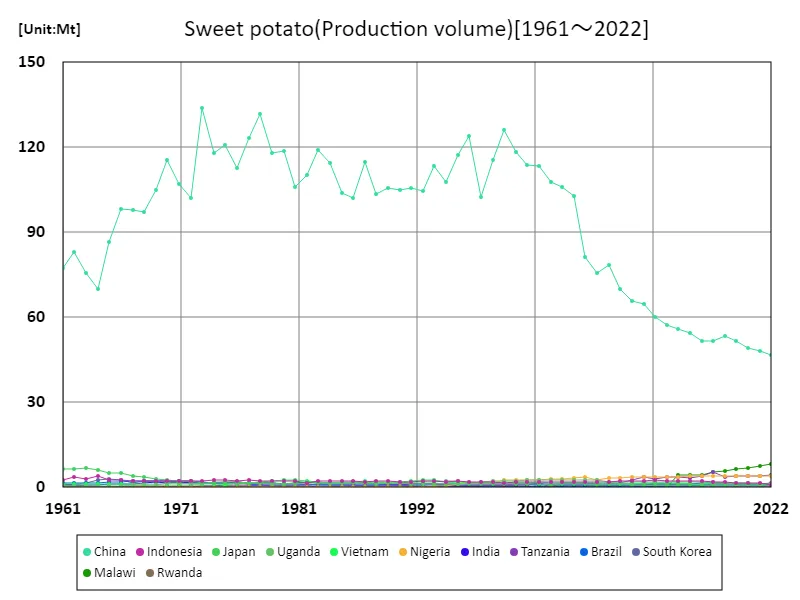
The maximum is 134Mt[1973] of China, and the current value is about 34.9%
Sweet potato production (latest year, countries around the world)
The latest data on the global yield of sweet potatoes is interesting. According to statistics for 2022, the average sweet potato yield worldwide is 11.6 tons per hectare, with a total production of 1.29 kilotons. And the country with the largest production is Guyana, which achieves an astounding figure of 103 tons per hectare. From this data, we can see that sweet potato production varies greatly from region to region, with some countries, like Guyana, achieving very high yields. Behind this success are suitable climatic conditions, soils, and potential. On the other hand, the average yield worldwide still has room for improvement. Increasing sweet potato production requires innovation in agricultural technology and the adoption of sustainable agricultural practices. There is also a risk that factors such as climate change and natural disasters will affect production. International cooperation and knowledge sharing are important to address these challenges. Sweet potatoes are an important element of food security around the world, and sustainable production has a significant impact on local economies and food supplies.
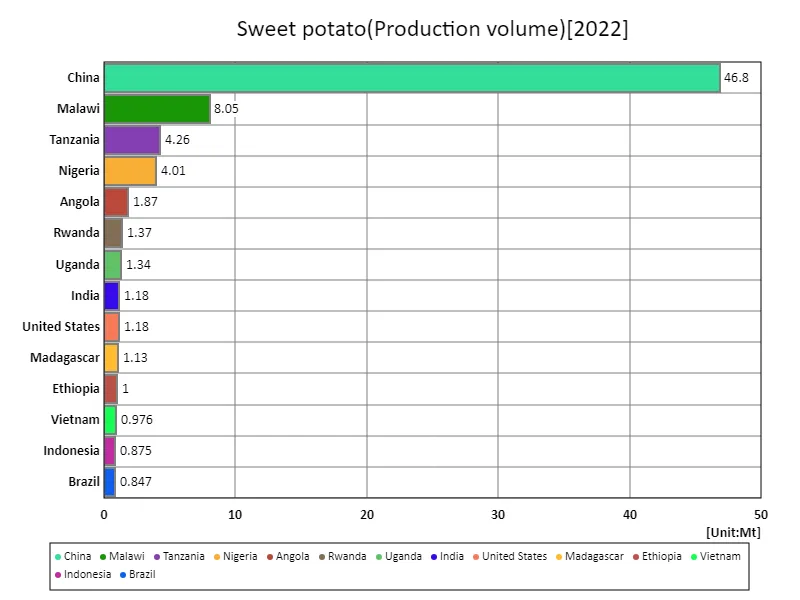
The maximum is 46.8Mt of China, the average is 758kt, and the total is 87.2Mt
Sweet potato production (continent)
The latest sweet potato yield data shows that Europe is the global leader in 2022, with an astounding production of 26.9 tonnes/hectare. This figure breaks previous records and indicates that the current value is the highest ever. This trend may be due to innovations in agricultural techniques and management in Europe that are contributing to increased productivity. However, it is also noteworthy how much change is observed in other regions. For example, in some parts of Asia and Africa, sweet potato production may be affected by climatic conditions and land use characteristics. In addition, differences in economic factors and agricultural policies may also affect production. Considering these factors, there is regional diversity in global sweet potato production, suggesting that each region has its own challenges and opportunities. Going forward, the spread of sustainable agricultural practices and adaptation to climate change will be key themes in sweet potato production.
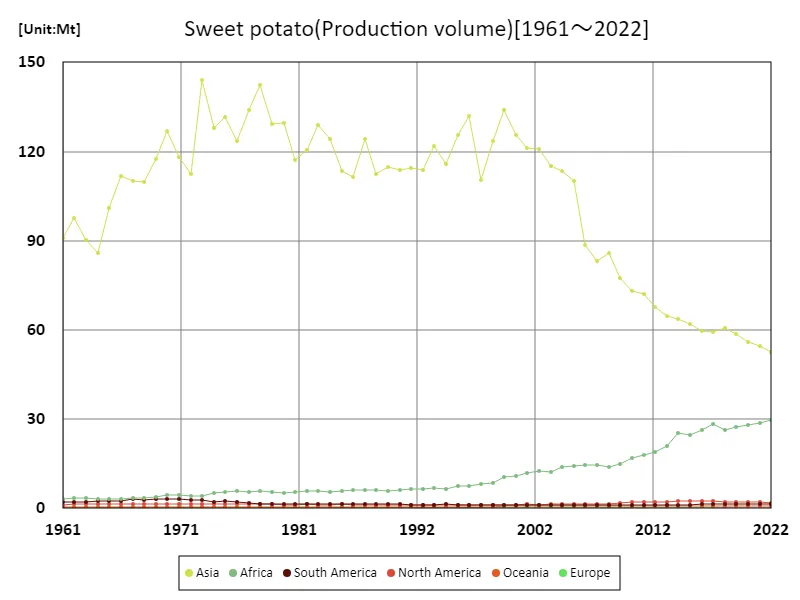
The maximum is 144Mt[1973] of Asia, and the current value is about 36.6%
Sweet potato production (latest year, continent)
Looking at the sweet potato production data for 2022, Asia has the largest production, recording a staggering figure of 20 tons per hectare. Also, the global average yield is 11.7 tons/hectare, with a total production reaching 58.6 kilotons. These figures make it clear that Asia is the center of global sweet potato production. This trend is supported by Asia’s vast farmland and long-standing agricultural experience. In particular, countries such as Japan and China are major sweet potato producers, with high production technology and abundant agricultural resources. On the other hand, it suggests that sweet potato production is not as high in other regions. This may be due to climatic conditions, land use constraints, and the spread of agricultural technology. Regional differences in sweet potato production may affect global food security. The adoption of sustainable agricultural practices and technological innovation are important to address these challenges. In addition, efforts are also needed to respond to the effects of climate change and changes in market demand. In the future, Asia’s leadership in global sweet potato production may be maintained, while other regions’ production may also improve.
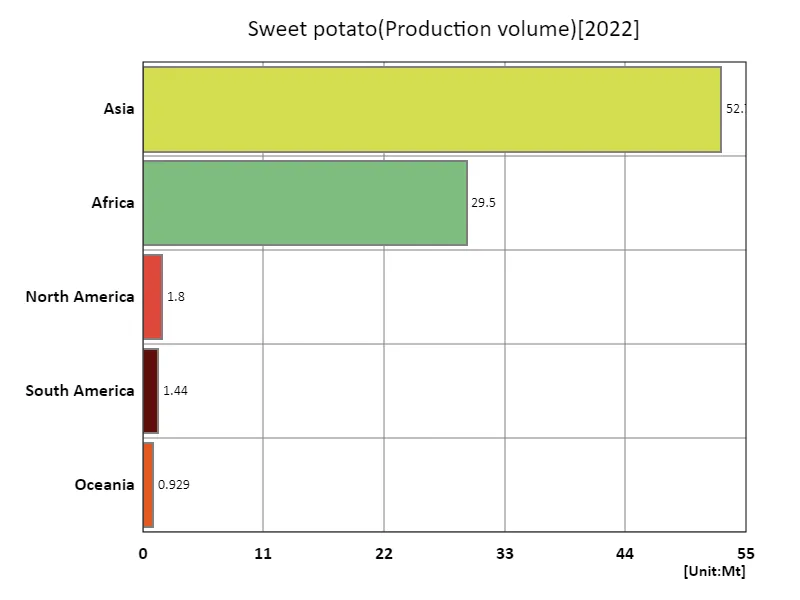
The maximum is 52.7Mt of Asia, the average is 17.3Mt, and the total is 86.4Mt
Main data
| Production(Sweet potato, Production volume, t) [Mt] | ||||||||||
|---|---|---|---|---|---|---|---|---|---|---|
| World | Asia | Upper-middle-income countries | Eastern Asia | China | Africa | Net Food Importing Developing Countries | Least Developed Countries | Low Income Food Deficit Countries | Eastern Africa | |
| 2022 | 86.41 | 52.71 | 49.54 | 48.44 | 46.83 | 29.53 | 26.08 | 24.05 | 23.27 | 19.34 |
| 2021 | 87.49 | 54.53 | 51.31 | 49.54 | 47.96 | 28.6 | 25.2 | 23 | 22.32 | 18.59 |
| 2020 | 88.52 | 56.02 | 52.55 | 50.71 | 49.14 | 28.17 | 24.7 | 22.63 | 21.98 | 18.27 |
| 2019 | 90.77 | 58.69 | 55.3 | 53.44 | 51.75 | 27.5 | 24.26 | 21.77 | 21.54 | 18.17 |
| 2018 | 91.53 | 60.81 | 57.03 | 54.97 | 53.25 | 26.34 | 23.13 | 20.65 | 20.23 | 16.87 |
| 2017 | 92.45 | 59.14 | 55.56 | 53.27 | 51.69 | 28.49 | 25.35 | 23.17 | 22.37 | 18.82 |
| 2016 | 90.38 | 59.58 | 55.72 | 53.52 | 51.63 | 26.17 | 23.27 | 20.97 | 20.03 | 16.86 |
| 2015 | 91.32 | 62.03 | 58.52 | 55.96 | 54.43 | 24.69 | 22 | 19.29 | 18.7 | 15.82 |
| 2014 | 93.49 | 63.62 | 60.09 | 57.62 | 56.02 | 25.25 | 22.88 | 20.71 | 19.62 | 16.57 |
| 2013 | 90.18 | 64.83 | 61.09 | 58.83 | 57.11 | 21.02 | 18.69 | 16.62 | 16.25 | 12.78 |
| 2012 | 90.72 | 67.7 | 64 | 61.61 | 60.01 | 18.79 | 16.45 | 14.37 | 14.62 | 11.23 |
| 2011 | 94.47 | 72.21 | 68.59 | 66.43 | 64.85 | 18.04 | 15.81 | 13.91 | 13.61 | 10.65 |
| 2010 | 93.89 | 73.03 | 69.41 | 67.4 | 65.81 | 16.86 | 14.65 | 12.56 | 12.28 | 9.78 |
| 2009 | 96.16 | 77.49 | 73.63 | 71.81 | 70.04 | 14.98 | 13 | 10.68 | 10.49 | 8.47 |
| 2008 | 103.18 | 85.71 | 81.8 | 80.16 | 78.44 | 13.96 | 11.72 | 9.77 | 9.74 | 7.66 |
| 2007 | 101.19 | 83.12 | 79.27 | 77.49 | 75.8 | 14.5 | 13.2 | 11.2 | 10.96 | 8.89 |
| 2006 | 106.63 | 88.51 | 84.63 | 82.91 | 81.27 | 14.71 | 12.24 | 10.45 | 10.37 | 8.45 |
| 2005 | 127.73 | 110.16 | 106.24 | 104.43 | 102.75 | 14.11 | 12.08 | 10.22 | 10.09 | 8.32 |
| 2004 | 130.71 | 113.34 | 109.47 | 107.55 | 105.84 | 13.86 | 12.03 | 10.34 | 10.11 | 8.5 |
| 2003 | 130.93 | 115.26 | 111.45 | 109.31 | 107.75 | 12.19 | 10.68 | 8.89 | 8.7 | 7.08 |
| 2002 | 136.73 | 120.84 | 116.67 | 114.99 | 113.3 | 12.7 | 11.26 | 9.7 | 9.6 | 8.07 |
| 2001 | 136.13 | 121.04 | 117.11 | 115.44 | 113.78 | 11.81 | 10.52 | 8.79 | 8.83 | 7.38 |
| 2000 | 139.71 | 125.68 | 121.45 | 119.89 | 118.18 | 10.95 | 9.64 | 8.1 | 8.17 | 6.74 |
| 1999 | 147.21 | 133.83 | 129.17 | 128.07 | 126.14 | 10.45 | 9.08 | 7.55 | 7.92 | 6.27 |
| 1998 | 134.82 | 123.37 | 118.96 | 117.54 | 115.64 | 8.56 | 8.1 | 6.77 | 6.87 | 5.39 |
| 1997 | 121.32 | 110.29 | 105.79 | 104.34 | 102.62 | 8.14 | 7.74 | 6.5 | 6.44 | 5.01 |
| 1996 | 142 | 131.81 | 127.24 | 125.58 | 123.96 | 7.37 | 6.97 | 5.96 | 5.63 | 4.35 |
| 1995 | 135.99 | 125.43 | 121.01 | 119.01 | 117.38 | 7.56 | 7.56 | 6.49 | 6.17 | 4.94 |
| 1994 | 125.48 | 115.78 | 111.06 | 109.35 | 107.65 | 6.6 | 7.48 | 6.49 | 6.13 | 4.88 |
| 1993 | 131.54 | 121.91 | 116.82 | 114.79 | 113.34 | 6.76 | 7.58 | 6.55 | 6.19 | 5 |
| 1992 | 123.23 | 113.86 | 108.26 | 106.54 | 104.64 | 6.38 | 7.47 | 6.49 | 6.18 | 4.88 |
| 1991 | 123.7 | 114.36 | 109.02 | 107.46 | 105.62 | 6.46 | 7.51 | 6.42 | 6.22 | 4.98 |
| 1990 | 122.77 | 113.69 | 108.35 | 106.99 | 104.9 | 6.06 | 7.23 | 6.26 | 5.91 | 4.58 |
| 1989 | 123.72 | 114.88 | 109.38 | 107.92 | 105.65 | 5.77 | 6.97 | 6.09 | 5.72 | 4.43 |
| 1988 | 121.96 | 112.59 | 107.19 | 105.6 | 103.46 | 6.14 | 7.41 | 6.23 | 6.05 | 4.73 |
| 1987 | 133.65 | 124.26 | 118.3 | 117 | 114.79 | 6.11 | 7.31 | 6.18 | 6.12 | 4.81 |
| 1986 | 120.95 | 111.5 | 105.57 | 104.44 | 102.01 | 6.16 | 7.45 | 6.3 | 6.17 | 4.89 |
| 1985 | 122.99 | 113.6 | 107.38 | 106.35 | 103.8 | 5.98 | 7.42 | 6.24 | 6 | 4.69 |
| 1984 | 133.03 | 124.25 | 118.12 | 117.13 | 114.61 | 5.42 | 7.01 | 6 | 5.49 | 4.16 |
| 1983 | 137.94 | 129.06 | 122.34 | 121.61 | 119.02 | 5.67 | 7.26 | 6.32 | 5.73 | 4.46 |
| 1982 | 129.43 | 120.39 | 112.96 | 112.72 | 110.29 | 5.69 | 7.15 | 5.91 | 5.68 | 4.44 |
| 1981 | 125.54 | 117.01 | 108.94 | 108.77 | 106.01 | 5.36 | 6.87 | 5.79 | 5.35 | 4.16 |
| 1980 | 137.87 | 129.44 | 121.61 | 121.45 | 118.85 | 5.28 | 6.85 | 5.78 | 5.26 | 4.08 |
| 1979 | 137.93 | 129.09 | 120.86 | 120.84 | 117.91 | 5.38 | 7.04 | 5.85 | 5.33 | 4.14 |
| 1978 | 151.85 | 142.48 | 134.29 | 134.78 | 131.6 | 5.78 | 7.47 | 6.3 | 5.81 | 4.6 |
| 1977 | 143.1 | 134 | 126.33 | 126.52 | 123.35 | 5.37 | 6.97 | 5.96 | 5.43 | 4.17 |
| 1976 | 133.32 | 123.43 | 115.65 | 115.79 | 112.55 | 5.77 | 7.44 | 6.37 | 5.79 | 4.55 |
| 1975 | 141.31 | 131.5 | 123.76 | 124.44 | 120.91 | 5.45 | 7.02 | 5.9 | 5.44 | 4.26 |
| 1974 | 137.26 | 128 | 120.37 | 121.03 | 117.99 | 5.03 | 6.45 | 5.39 | 5.01 | 3.86 |
| 1973 | 152.86 | 144.01 | 136.32 | 137.44 | 134.01 | 4.3 | 5.7 | 4.72 | 4.27 | 3.16 |
| 1972 | 121.46 | 112.43 | 104.67 | 106.11 | 102.03 | 4.16 | 5.56 | 4.58 | 4.08 | 2.99 |
| 1971 | 127.25 | 117.99 | 109.4 | 111.22 | 107.04 | 4.37 | 5.9 | 4.92 | 4.3 | 3.22 |
| 1970 | 136.5 | 127.02 | 117.58 | 120.28 | 115.34 | 4.58 | 6.09 | 5.12 | 4.49 | 3.39 |
| 1969 | 126.16 | 117.41 | 107.12 | 110.23 | 105.01 | 3.78 | 5.17 | 4.22 | 3.6 | 2.54 |
| 1968 | 118.09 | 109.77 | 99.37 | 103 | 97.1 | 3.62 | 4.97 | 4.06 | 3.47 | 2.43 |
| 1967 | 118.61 | 110.12 | 99.99 | 103.91 | 97.98 | 3.57 | 4.86 | 3.98 | 3.41 | 2.4 |
| 1966 | 119.68 | 111.93 | 100.41 | 105.99 | 98.22 | 3.23 | 4.24 | 3.35 | 3.07 | 2.12 |
| 1965 | 108.37 | 100.86 | 88.91 | 94.6 | 86.45 | 3.18 | 4.15 | 3.29 | 3 | 2.08 |
| 1964 | 93.37 | 85.96 | 73.35 | 78.58 | 69.87 | 3.24 | 4.24 | 3.33 | 3.05 | 2.1 |
| 1963 | 98 | 90.4 | 79.48 | 84.03 | 75.78 | 3.42 | 4.33 | 3.48 | 3.25 | 2.26 |
| 1962 | 105.29 | 97.63 | 86.32 | 90.7 | 83.11 | 3.57 | 4.38 | 3.6 | 3.41 | 2.39 |
| 1961 | 98.19 | 91.07 | 78.98 | 84.83 | 77.29 | 3.28 | 4 | 3.28 | 3.12 | 2.13 |


Comments