
Abstract
Yams are a globally important agricultural crop, with production varying by region. According to the latest data for 2022, Guyana has the highest production, achieving 74.3 tons per hectare. This is an astounding figure, showing that yam production is an important economic activity in the region. On the other hand, production varies in other countries. For example, yam production is thriving in West African countries and contributes significantly to the local economy. Yams are also cultivated in some parts of Asia and South America, but production tends to be relatively low. Thus, yam production varies by region, but Guyana’s high productivity is noteworthy. Climate change and technological innovation may continue to affect production, and countries will need to work to adopt sustainable production methods and improve productivity.
Yam production (worldwide)
The data on yam production is interesting, especially the recent trends, from 1961 to 2022. It shows that Guyana recorded the highest production in 2016, achieving 77.1 tons per hectare. However, a look at the data since then shows that Guyana’s production has declined to 96.4% from its peak. This is an important trend and suggests that there has been some change in yam production. There are various factors behind this trend. For example, changes in weather conditions such as climate change and natural disasters may have affected production. It is also possible that the lack of progress in improving agricultural techniques and cultivation methods or the lack of development of agricultural infrastructure may have had an impact. In addition, it cannot be ruled out that economic and political fluctuations have affected agricultural production. The decline in yam production from its peak is a significant issue for the region’s agricultural economy and food supply, and calls for sustainable agricultural practices and efforts to improve productivity. In the future, efforts should be made to stabilize yam production, taking these factors into account.
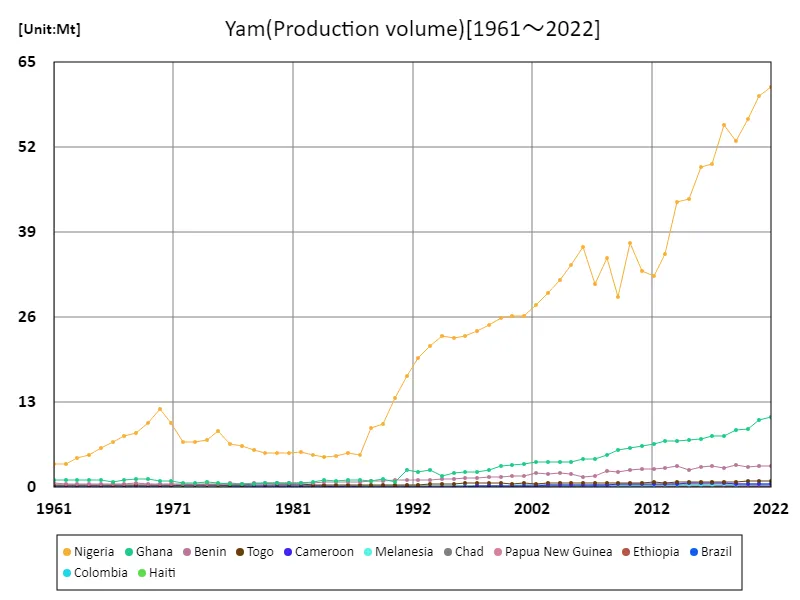
The maximum is the latest one, 61.2Mt of Nigeria
Yam production (latest year, countries around the world)
Looking at the 2022 yam production data, Guyana recorded the highest production of 74.3 t/ha, indicating its status as a global yam production center. The average of 10.5 t/ha and the total of 606 t/ha also show that yam production is relatively high. This data suggests that certain regions have advantages in yam production. Guyana’s high productivity may be due to the region’s favorable climate and soil conditions, as well as the adoption of efficient cultivation methods due to advances in agricultural technology. On the other hand, the production in other regions is below average, suggesting that conditions suitable for yam growth are not necessarily in place in all regions. Furthermore, high yam production plays an important role for local economies and food supplies. In particular, in areas with high production, it contributes to the development of local economies and improved food security. However, areas with low production will be required to improve productivity and introduce sustainable agricultural methods. Factors such as climate change and technological innovation may continue to affect yam production in the future. Therefore, regions need to take appropriate measures to ensure sustainable yam production.
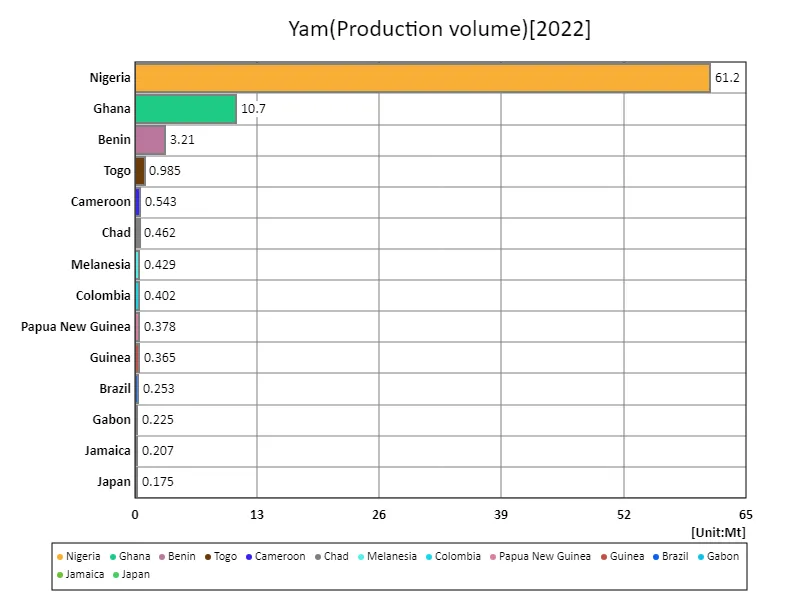
The maximum is 61.2Mt of Nigeria, the average is 1.39Mt, and the total is 80.6Mt
Yam production (continent)
The 2022 yam production data shows that Asia recorded the highest yield of 19.7 t/ha, which is the current maximum. This data is interesting and suggests that Asia is making great progress in yam production. This trend may be due to the advancement of agricultural technology and improved cultivation methods in the Asian region. It may also be due to cultivation that is suited to the natural environment of the region, such as proper use of climatic conditions and soil. In addition, the efficiency and diversification of agricultural production due to the high population density and increasing food demand in the Asian region may also be a factor. The fact that Asia has recorded the largest yield in yam production is important for the stability of food supply and economic growth in the region. In addition, Asia’s success story can be instructive for other regions and can serve as a model for sustainable agricultural production. However, despite the success, there are challenges related to agriculture in the Asian region. For example, sustainability and the social impact of agriculture. Therefore, efforts to address these challenges will be required in agricultural policies and technology development in the Asian region. Overall, the current situation in which Asia has recorded the largest yam production indicates the progress and growth of agriculture in the region and is expected to continue in efforts towards sustainable agricultural production.
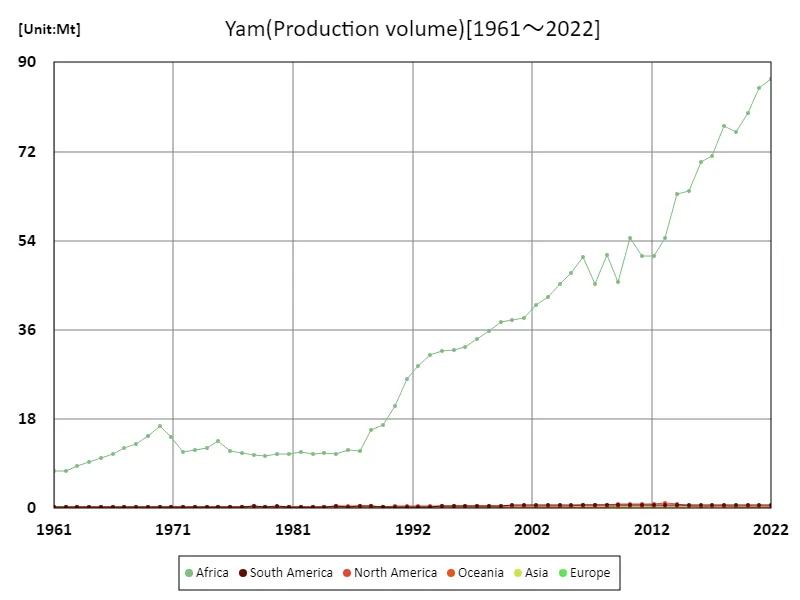
The maximum is the latest one, 86.6Mt of Africa
Yam production (latest year, continent)
Yam production data for 2022 shows that Asia recorded the highest yield of 19.2 t/ha, which is the current maximum. The average is 12.5 t/ha, which shows the difference in productivity in each region. The overall total is 62.6 t/ha, which suggests that yam production is carried out at a relatively high level. The fact that Asia recorded the highest yield in yam production may be due to the progress of agricultural technology and improved cultivation methods in the region. It may also be that cultivation is carried out in a way that is suitable for the natural environment of the region, such as the proper use of climatic conditions and soil. On the other hand, the average figure of 12.5 t/ha suggests that yam production varies from region to region, and that production in some regions may be low. This is likely due to differences in agricultural infrastructure and technology levels in each region, as well as differences in climatic conditions. The relatively high level of yam production is important for the stability of food supply and economic growth in the region. However, there is no doubt that productivity improvements and the introduction of sustainable agricultural methods will continue to be required. In particular, in areas with low production, it will be important to share technology and know-how, and to promote agricultural education. In general, yam production has different characteristics in each region, and is an indication of the progress and growth of agriculture in the region, so it is expected that efforts for sustainable agricultural production will continue in the future.
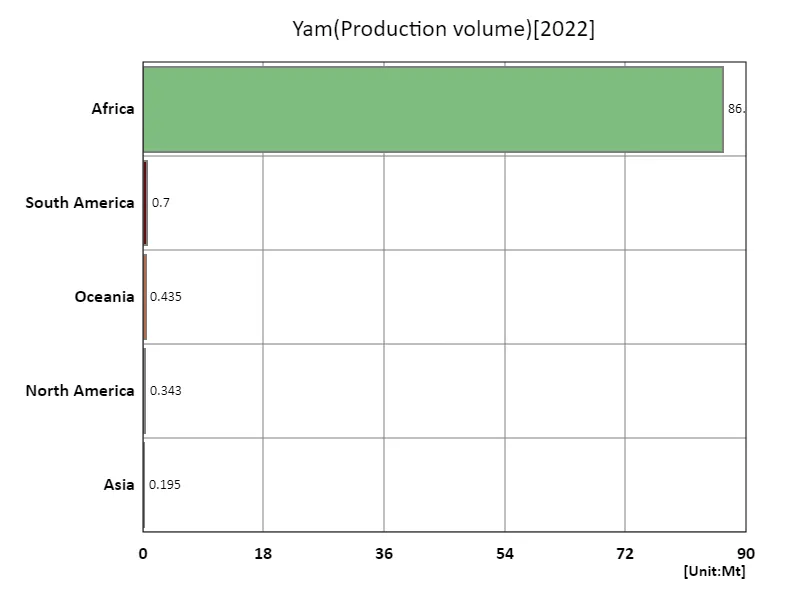
The maximum is 86.6Mt of Africa, the average is 17.7Mt, and the total is 88.3Mt
Main data
| Production(Yam, Production volume, t) [Mt] | ||||||||||
|---|---|---|---|---|---|---|---|---|---|---|
| World | Africa | Western Africa | Lower-middle-income countries | Nigeria | Net Food Importing Developing Countries | Ghana | Cote d’Ivoire | Low Income Food Deficit Countries | Least Developed Countries | |
| 2022 | 88.26 | 86.58 | 84.36 | 84.25 | 61.17 | 14.53 | 10.72 | 7.6 | 6.9 | 6.37 |
| 2021 | 86.4 | 84.72 | 82.52 | 82.44 | 59.88 | 14.42 | 10.28 | 7.59 | 6.79 | 6.29 |
| 2020 | 81.49 | 79.81 | 77.61 | 77.55 | 56.35 | 14.37 | 8.95 | 7.65 | 6.69 | 6.19 |
| 2019 | 77.65 | 75.99 | 73.8 | 73.86 | 52.91 | 14.18 | 8.75 | 7.45 | 6.71 | 6.21 |
| 2018 | 78.77 | 77.11 | 74.83 | 74.98 | 55.36 | 13.73 | 7.86 | 7.39 | 6.33 | 5.76 |
| 2017 | 72.83 | 71.18 | 68.9 | 69.09 | 49.52 | 13.62 | 7.86 | 7.15 | 6.48 | 5.9 |
| 2016 | 71.48 | 69.84 | 67.56 | 67.73 | 48.98 | 13.19 | 7.44 | 6.9 | 6.35 | 5.75 |
| 2015 | 65.87 | 64.06 | 61.77 | 62.21 | 44.1 | 12.65 | 7.3 | 6.65 | 6.05 | 5.46 |
| 2014 | 65.48 | 63.5 | 61.32 | 61.93 | 43.71 | 12.91 | 7.12 | 6.2 | 6.74 | 6.17 |
| 2013 | 56.8 | 54.52 | 52.37 | 52.98 | 35.62 | 12.34 | 7.07 | 5.73 | 6.31 | 5.77 |
| 2012 | 53.14 | 50.98 | 48.65 | 48.88 | 32.32 | 12.45 | 6.64 | 5.67 | 6.45 | 5.93 |
| 2011 | 53.13 | 50.9 | 48.71 | 49.07 | 33.13 | 11.93 | 6.3 | 5.53 | 6.07 | 5.56 |
| 2010 | 56.74 | 54.47 | 52.33 | 52.69 | 37.33 | 11.72 | 5.96 | 5.39 | 5.94 | 5.45 |
| 2009 | 47.74 | 45.61 | 43.52 | 43.84 | 29.09 | 11.19 | 5.78 | 5.31 | 5.53 | 5.08 |
| 2008 | 52.87 | 51.02 | 49.2 | 49.47 | 35.02 | 11.45 | 4.89 | 5.95 | 5.22 | 4.83 |
| 2007 | 47.16 | 45.31 | 43.47 | 43.76 | 31.14 | 10.15 | 4.38 | 5.5 | 4.35 | 3.98 |
| 2006 | 52.35 | 50.61 | 48.92 | 49.17 | 36.72 | 9.85 | 4.29 | 5.57 | 4.09 | 3.73 |
| 2005 | 49.15 | 47.44 | 45.87 | 46.15 | 34 | 9.77 | 3.92 | 5.16 | 4.41 | 4.08 |
| 2004 | 46.95 | 45.23 | 43.71 | 43.81 | 31.78 | 9.87 | 3.89 | 5 | 4.59 | 4.32 |
| 2003 | 44.27 | 42.6 | 41.09 | 41.24 | 29.7 | 9.38 | 3.81 | 4.84 | 4.28 | 4.01 |
| 2002 | 42.59 | 40.98 | 39.38 | 39.55 | 27.91 | 9.44 | 3.9 | 4.71 | 4.48 | 4.22 |
| 2001 | 40.08 | 38.48 | 36.89 | 36.96 | 26.23 | 9 | 3.55 | 4.58 | 4.16 | 3.9 |
| 2000 | 39.64 | 38.09 | 36.51 | 36.65 | 26.2 | 8.78 | 3.36 | 4.46 | 4.11 | 3.86 |
| 1999 | 39.01 | 37.51 | 35.98 | 35.97 | 25.87 | 8.65 | 3.25 | 4.34 | 4.11 | 3.85 |
| 1998 | 37.1 | 35.69 | 34.14 | 34.12 | 24.77 | 8.48 | 2.7 | 4.22 | 4.05 | 3.81 |
| 1997 | 35.55 | 34.15 | 32.74 | 32.69 | 23.97 | 8.18 | 2.41 | 4.11 | 3.77 | 3.62 |
| 1996 | 34.14 | 32.64 | 31.31 | 31.26 | 23.2 | 7.64 | 2.27 | 3.71 | 3.55 | 3.44 |
| 1995 | 33.27 | 31.87 | 30.57 | 30.58 | 22.82 | 7.36 | 2.13 | 3.62 | 3.4 | 3.27 |
| 1994 | 33.15 | 31.75 | 30.3 | 30.38 | 23.15 | 7.32 | 1.7 | 3.53 | 3.46 | 3.33 |
| 1993 | 32.29 | 31.02 | 29.66 | 29.67 | 21.63 | 7.07 | 2.72 | 3.44 | 3.32 | 3.21 |
| 1992 | 30 | 28.7 | 27.24 | 27.47 | 19.78 | 6.98 | 2.33 | 3.52 | 3.16 | 3.04 |
| 1991 | 27.23 | 26 | 24.57 | 24.74 | 16.96 | 6.75 | 2.63 | 3.26 | 3.23 | 3.11 |
| 1990 | 21.78 | 20.6 | 19.26 | 19.36 | 13.62 | 6.43 | 0.88 | 3.18 | 2.98 | 2.89 |
| 1989 | 17.93 | 16.75 | 15.53 | 15.54 | 9.61 | 6.21 | 1.26 | 3.09 | 2.85 | 2.8 |
| 1988 | 16.97 | 15.78 | 14.52 | 14.53 | 9.13 | 6.06 | 0.9 | 3 | 2.78 | 2.71 |
| 1987 | 12.81 | 11.59 | 10.36 | 10.4 | 4.89 | 5.8 | 1.19 | 2.91 | 2.64 | 2.54 |
| 1986 | 12.96 | 11.85 | 10.59 | 10.56 | 5.21 | 5.84 | 1.05 | 2.82 | 2.8 | 2.68 |
| 1985 | 12.11 | 10.92 | 9.66 | 9.67 | 4.74 | 5.49 | 0.99 | 2.65 | 2.59 | 2.51 |
| 1984 | 12.38 | 11.24 | 9.99 | 10.04 | 4.6 | 5.69 | 1.18 | 2.87 | 2.62 | 2.49 |
| 1983 | 11.98 | 10.9 | 9.6 | 9.64 | 5 | 5.22 | 0.87 | 2.56 | 2.51 | 2.36 |
| 1982 | 12.3 | 11.28 | 9.96 | 9.95 | 5.39 | 5.42 | 0.59 | 2.68 | 2.66 | 2.46 |
| 1981 | 12.02 | 10.95 | 9.66 | 9.59 | 5.21 | 5.28 | 0.59 | 2.49 | 2.68 | 2.48 |
| 1980 | 12 | 10.89 | 9.64 | 9.61 | 5.25 | 5.15 | 0.65 | 2.41 | 2.61 | 2.42 |
| 1979 | 11.6 | 10.47 | 9.28 | 9.26 | 5.26 | 4.79 | 0.6 | 2.07 | 2.58 | 2.39 |
| 1978 | 11.97 | 10.79 | 9.61 | 9.59 | 5.78 | 4.65 | 0.54 | 1.98 | 2.53 | 2.33 |
| 1977 | 12.21 | 11.12 | 9.91 | 10.01 | 6.38 | 4.34 | 0.54 | 1.89 | 2.36 | 2.14 |
| 1976 | 12.55 | 11.54 | 10.31 | 10.41 | 6.56 | 4.51 | 0.58 | 2.03 | 2.43 | 2.18 |
| 1975 | 14.59 | 13.6 | 12.39 | 12.54 | 8.62 | 4.33 | 0.71 | 2.08 | 2.25 | 1.95 |
| 1974 | 13.18 | 12.21 | 10.96 | 11.18 | 7.16 | 4.19 | 0.85 | 2 | 2.26 | 1.9 |
| 1973 | 12.67 | 11.71 | 10.44 | 10.69 | 6.94 | 4.04 | 0.69 | 1.8 | 2.34 | 1.95 |
| 1972 | 12.35 | 11.39 | 10.15 | 10.38 | 6.9 | 3.8 | 0.68 | 1.53 | 2.34 | 1.97 |
| 1971 | 15.28 | 14.35 | 13.18 | 13.43 | 9.77 | 3.72 | 0.91 | 1.56 | 2.17 | 1.87 |
| 1970 | 17.43 | 16.53 | 15.41 | 15.63 | 12.03 | 3.63 | 0.91 | 1.55 | 2.09 | 1.83 |
| 1969 | 15.51 | 14.63 | 13.57 | 13.71 | 9.79 | 3.6 | 1.33 | 1.52 | 2.05 | 1.85 |
| 1968 | 13.87 | 12.98 | 11.91 | 12.07 | 8.23 | 3.58 | 1.24 | 1.39 | 2.17 | 1.96 |
| 1967 | 13.13 | 12.27 | 11.25 | 11.41 | 7.81 | 3.42 | 1.13 | 1.35 | 2.03 | 1.83 |
| 1966 | 11.87 | 11.01 | 10.02 | 10.17 | 6.99 | 3.24 | 0.87 | 1.32 | 1.89 | 1.7 |
| 1965 | 11.04 | 10.22 | 9.29 | 9.41 | 6 | 3.26 | 1.06 | 1.3 | 1.91 | 1.74 |
| 1964 | 10.07 | 9.25 | 8.34 | 8.47 | 5 | 3.2 | 1.15 | 1.26 | 1.89 | 1.72 |
| 1963 | 9.4 | 8.61 | 7.7 | 7.82 | 4.5 | 3.1 | 1.1 | 1.23 | 1.82 | 1.65 |
| 1962 | 8.31 | 7.55 | 6.68 | 6.79 | 3.5 | 3.03 | 1.1 | 1.2 | 1.78 | 1.61 |
| 1961 | 8.32 | 7.59 | 6.76 | 6.85 | 3.5 | 3.06 | 1.1 | 1.15 | 1.87 | 1.7 |


Comments