Abstract
Looking at the volume of onion imports in global agriculture based on data for 2021, the United States is the largest importer, with imports reaching 666kt. This shows that it has maintained a consistently high level given the trends over the past few years. The main feature of US onion imports is that imports are at a stable and high level to meet growing domestic demand and production shortages due to seasonal factors. Other major importing countries also need stable imports due to fluctuations in domestic demand and production constraints. This shows that imports play an important role in the global onion market, and import volumes will need to be maintained or expanded in order to meet growing demand in the future.
Onion imports (worldwide)
Onion imports in world agriculture have changed between 1961 and 2021. Of particular note is the largest import volume of 768kt recorded by Bangladesh in 2009. Since then, imports have declined to 74.3% of the peak. This trend is due to several factors. First, there is an increase in onion production in Bangladesh. This is supported by improvements in agricultural technology and the expansion of cultivated land. Secondly, changes in domestic demand have had an impact. Onions are a basic food ingredient in many countries and demand has remained stable, but due to increased domestic production, dependence on imports has decreased. Changes in transportation costs and trade policies also affect import volumes. Such trends reflect the regional balance of world agriculture and the influence of domestic policies. In the future, we may see fluctuations in import volumes depending on technological innovations in agricultural production and changes in demand.
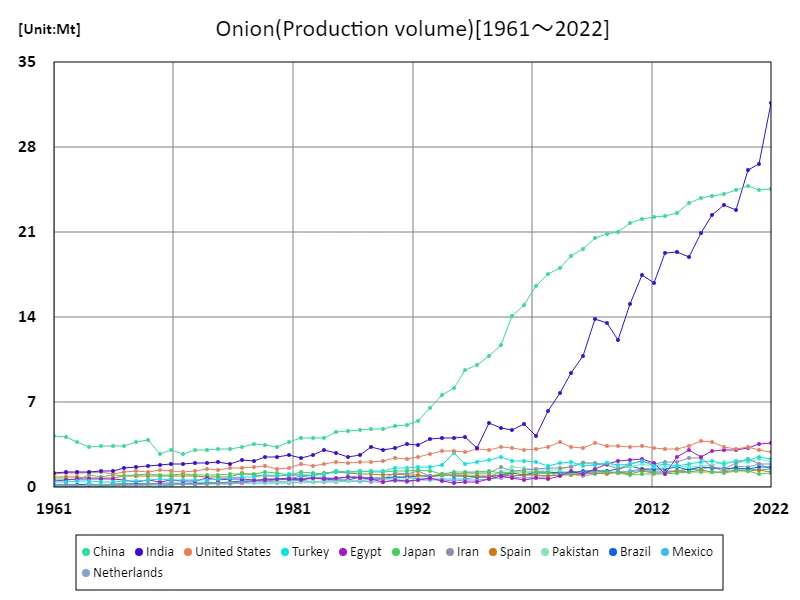
The maximum is the latest one, 31.7Mt of India
Onion import volume (latest year, countries around the world)
Imports of agricultural onions reached 8.13 Mt worldwide in 2021. Of these, the United States accounted for the largest share with 666 kt. The average import volume was 49.3 kt, which indicates that international trade in onions is relatively stable. This trend is shaped by various factors related to imports. First of all, due to differences in climatic conditions and agricultural techniques between regions, some countries may not produce enough onions. This makes imports necessary to meet demand. Changes in domestic demand and changes in consumption patterns also affect import volumes. For example, the demand for onions may increase with population growth and urbanization. In addition, trade policies and regulations such as tariffs also affect import volumes. These factors interact to shape the global onion market. In the future, fluctuations in import volumes are expected due to factors such as climate change and advances in agricultural technology.
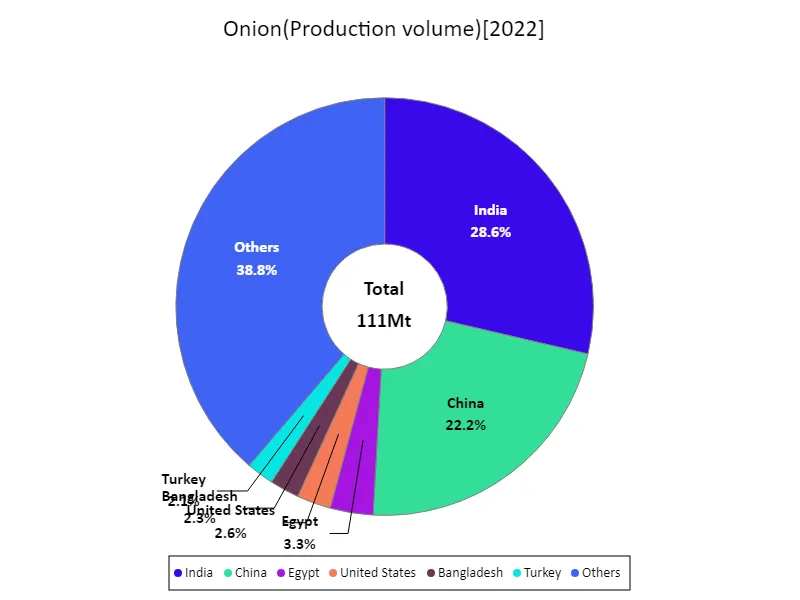
The maximum is 31.7Mt of India, the average is 774kt, and the total is 111Mt
Onion imports (continent)
In 2021, Asia recorded the highest overall import volume of agricultural onions, reaching 4.21 Mt. This figure indicates that Asia is playing an increasingly important role in the global onion market. This reflects the increasing demand for food due to economic growth and population growth in the Asian region. In addition, some Asian countries have technological and infrastructure constraints in onion production, so imports may be increasing to meet demand. On the other hand, onion imports may also be increasing in other regions. This may be due to the need for imports due to reduced harvests due to climate change or natural disasters, or to meet a sudden increase in domestic demand. In addition, factors such as trade agreements and tariff fluctuations may also affect import volumes. Thus, imports of agricultural onions are affected by different factors in each region. In the future, factors such as global population growth and climate change may affect import volumes, and it is expected that the global agricultural market will change while taking into account their impacts.
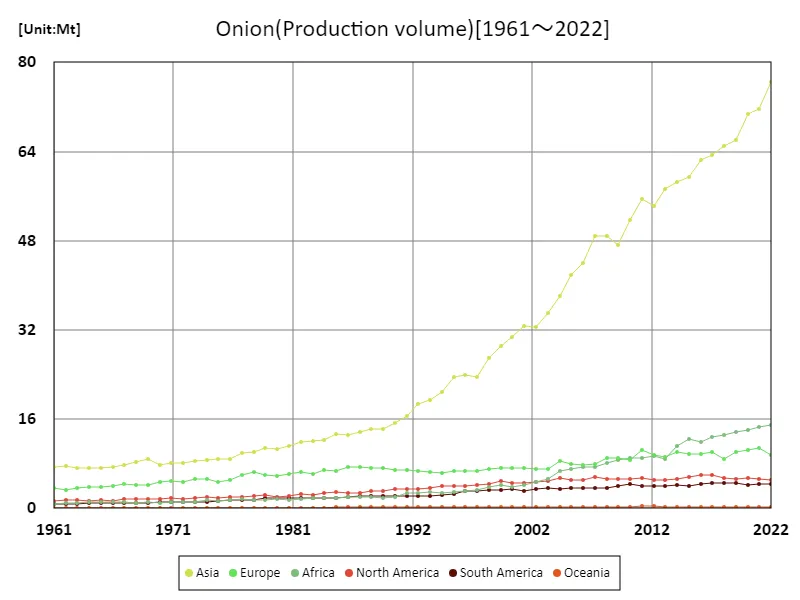
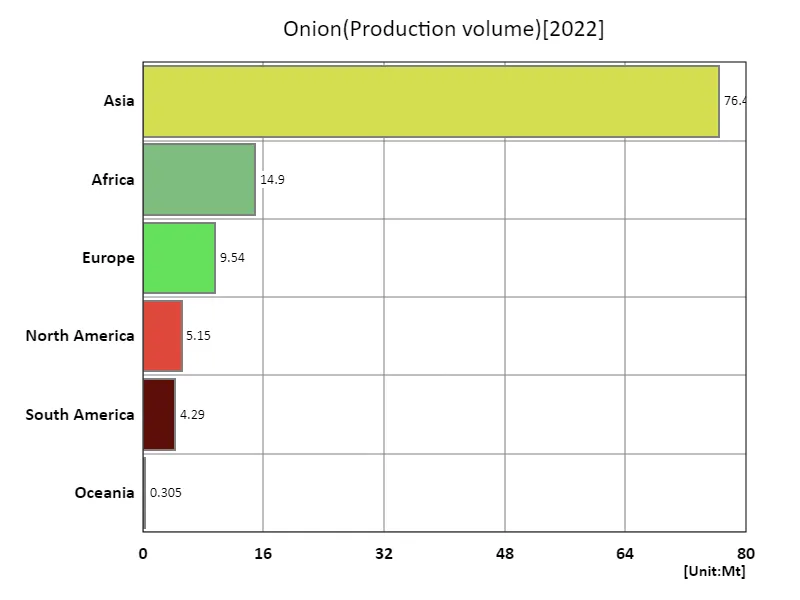
The maximum is the latest one, 76.4Mt of Asia
Onion import volume (latest year, continent)
Imports of agricultural onions reached 4 Mt in 2021, the highest overall, in Asia. This indicates that the Asian region is a major player in the global onion market. Factors that drive Asian imports far above other regions include population growth and increased food demand due to economic growth. It is also possible that imports are increasing in some Asian countries because onion production cannot meet domestic demand. On the other hand, onion imports have also been shown to be on the rise in regions outside Asia. This may be due to production effects from climate change and natural disasters, or changes in consumer demand. In addition, changes in trade policies and international agricultural agreements may also be affecting import volumes. Overall, global onion imports have remained stable, averaging 1.35 Mt in 2021, suggesting that the balance between supply and demand is relatively well maintained. However, different factors affect each region, and climate change and changes in trade policies may affect import volumes in the future.
The maximum is 76.4Mt of Asia, the average is 18.4Mt, and the total is 111Mt
Main data
| Production(Onion, Production volume, t) [Mt] | ||||||||||
|---|---|---|---|---|---|---|---|---|---|---|
| World | Asia | Lower-middle-income countries | Upper-middle-income countries | Southern Asia | India | Eastern Asia | China | Net Food Importing Developing Countries | Africa | |
| 2022 | 110.62 | 76.43 | 52.54 | 39.16 | 38.77 | 31.69 | 27.12 | 24.61 | 17.57 | 14.9 |
| 2021 | 106.75 | 71.7 | 47.6 | 39.06 | 33.79 | 26.64 | 27.27 | 24.49 | 17.4 | 14.52 |
| 2020 | 105.11 | 70.66 | 46.62 | 39.08 | 32.97 | 26.09 | 27.44 | 24.82 | 16.36 | 14.08 |
| 2019 | 100.08 | 66.14 | 42.31 | 38.58 | 29.11 | 22.82 | 27.53 | 24.5 | 15.86 | 13.72 |
| 2018 | 97.41 | 65.04 | 42.12 | 37.79 | 28.89 | 23.26 | 26.95 | 24.18 | 15.32 | 13.22 |
| 2017 | 97.08 | 63.39 | 40.4 | 38.15 | 28.15 | 22.43 | 26.5 | 24.03 | 14.98 | 12.75 |
| 2016 | 94.84 | 62.45 | 39.13 | 37.4 | 27.07 | 20.93 | 26.43 | 23.79 | 14.03 | 11.93 |
| 2015 | 91.57 | 59.47 | 37.73 | 36.55 | 25.06 | 18.93 | 25.89 | 23.44 | 14.75 | 12.4 |
| 2014 | 89.45 | 58.56 | 36.67 | 35.51 | 24.96 | 19.4 | 25.45 | 22.59 | 13.54 | 11.18 |
| 2013 | 84.77 | 57.31 | 34.31 | 34.73 | 24.53 | 19.3 | 24.81 | 22.35 | 11.28 | 8.9 |
| 2012 | 82.56 | 54.18 | 32.28 | 34.56 | 22.01 | 16.81 | 24.63 | 22.24 | 11.84 | 9.3 |
| 2011 | 84.67 | 55.5 | 33.04 | 35.02 | 23.08 | 17.51 | 24.74 | 22.06 | 12.19 | 8.99 |
| 2010 | 79.14 | 51.63 | 29.77 | 33.88 | 20.05 | 15.12 | 24.29 | 21.75 | 11.43 | 9.08 |
| 2009 | 74.37 | 47.21 | 25.96 | 32.59 | 16.59 | 12.16 | 23.66 | 21.05 | 10.96 | 8.64 |
| 2008 | 75.01 | 48.84 | 27.51 | 32.41 | 18.79 | 13.57 | 23.22 | 20.82 | 10.86 | 8.1 |
| 2007 | 73.79 | 48.86 | 26.97 | 31.5 | 19.16 | 13.9 | 23.13 | 20.57 | 10.22 | 7.49 |
| 2006 | 68.17 | 44.05 | 23.38 | 30.05 | 16.26 | 10.85 | 21.74 | 19.6 | 10.28 | 7.38 |
| 2005 | 65.76 | 41.81 | 21.11 | 29.64 | 14.03 | 9.43 | 21.25 | 19.05 | 9.63 | 7.11 |
| 2004 | 62.45 | 38.09 | 18.14 | 28.47 | 11.66 | 7.76 | 20.21 | 18.05 | 8.41 | 6.69 |
| 2003 | 56.29 | 35.1 | 15.06 | 27.5 | 9.99 | 6.27 | 19.54 | 17.54 | 7.32 | 5.33 |
| 2002 | 52.75 | 32.54 | 12.75 | 26.49 | 7.86 | 4.21 | 18.84 | 16.54 | 6.82 | 4.75 |
| 2001 | 52.03 | 32.72 | 13.74 | 24.96 | 8.98 | 5.25 | 17.44 | 15.02 | 6.36 | 4.18 |
| 2000 | 49.96 | 30.67 | 12.94 | 23.87 | 8.5 | 4.72 | 16.31 | 14.1 | 6.04 | 3.74 |
| 1999 | 49.04 | 29.04 | 13.2 | 22.43 | 8.56 | 4.9 | 13.95 | 11.73 | 5.76 | 4.2 |
| 1998 | 45.68 | 26.93 | 12.35 | 20.47 | 8.44 | 5.33 | 13.15 | 10.84 | 5.37 | 3.9 |
| 1997 | 40.98 | 23.51 | 9.67 | 19.08 | 6.36 | 3.2 | 12.12 | 10.04 | 4.66 | 3.36 |
| 1996 | 41.05 | 23.96 | 10.54 | 18.3 | 7.36 | 4.18 | 11.57 | 9.64 | 4.35 | 3.08 |
| 1995 | 39.81 | 23.49 | 10.27 | 17.01 | 7.16 | 4.08 | 10.53 | 8.2 | 4.05 | 2.89 |
| 1994 | 36.44 | 20.81 | 10.01 | 15.01 | 7.03 | 4.04 | 9.36 | 7.63 | 4.04 | 2.82 |
| 1993 | 34.8 | 19.35 | 9.9 | 13.48 | 6.8 | 4.01 | 8.53 | 6.53 | 4.15 | 2.97 |
| 1992 | 34.02 | 18.72 | 10.03 | 12.84 | 6.62 | 3.49 | 7.72 | 5.43 | 3.97 | 2.71 |
| 1991 | 32.03 | 16.55 | 8.12 | 13.41 | 6.42 | 3.58 | 7.06 | 5.14 | 3.88 | 2.82 |
| 1990 | 30.1 | 15.3 | 7.18 | 13.31 | 5.36 | 3.23 | 6.84 | 5.03 | 2.99 | 2.09 |
| 1989 | 28.87 | 14.22 | 6.43 | 12.88 | 4.68 | 3.07 | 6.73 | 4.82 | 2.81 | 1.88 |
| 1988 | 28.9 | 14.21 | 6.69 | 12.95 | 4.79 | 3.35 | 6.67 | 4.82 | 2.79 | 1.97 |
| 1987 | 28.37 | 13.77 | 6.39 | 12.68 | 4.39 | 2.7 | 6.63 | 4.73 | 2.78 | 2.01 |
| 1986 | 27.45 | 13.19 | 6.15 | 12.42 | 4.07 | 2.53 | 6.33 | 4.63 | 2.82 | 2.06 |
| 1985 | 26.8 | 13.34 | 6.13 | 11.47 | 4.28 | 2.86 | 6.37 | 4.53 | 2.58 | 1.87 |
| 1984 | 25.68 | 12.32 | 6.39 | 10.73 | 4.62 | 3.1 | 5.37 | 4.04 | 2.44 | 1.81 |
| 1983 | 24.37 | 12.08 | 5.78 | 10.34 | 4.15 | 2.7 | 5.78 | 4.02 | 2.49 | 1.78 |
| 1982 | 24.63 | 11.94 | 5.61 | 10.33 | 4.04 | 2.43 | 5.78 | 4.04 | 2.36 | 1.66 |
| 1981 | 23 | 11.23 | 5.36 | 9.82 | 3.93 | 2.65 | 5.13 | 3.77 | 2.15 | 1.57 |
| 1980 | 22 | 10.57 | 5.31 | 9.22 | 3.78 | 2.5 | 4.74 | 3.28 | 2.32 | 1.6 |
| 1979 | 22.58 | 10.83 | 4.97 | 9.53 | 3.61 | 2.5 | 5.15 | 3.47 | 2.13 | 1.5 |
| 1978 | 21.86 | 10.1 | 4.69 | 9.17 | 3.24 | 2.2 | 4.85 | 3.54 | 2.04 | 1.45 |
| 1977 | 21 | 9.84 | 4.71 | 8.38 | 3.15 | 2.23 | 4.75 | 3.35 | 2.13 | 1.58 |
| 1976 | 19.08 | 8.93 | 4.24 | 8.02 | 2.82 | 1.95 | 4.43 | 3.16 | 2.07 | 1.53 |
| 1975 | 18.35 | 8.86 | 4.28 | 7.62 | 2.93 | 2.1 | 4.3 | 3.16 | 1.87 | 1.37 |
| 1974 | 18.79 | 8.72 | 4.19 | 7.69 | 2.75 | 2 | 4.24 | 3.07 | 1.91 | 1.42 |
| 1973 | 17.83 | 8.43 | 3.89 | 7.52 | 2.68 | 1.98 | 4.14 | 3.03 | 1.62 | 1.16 |
| 1972 | 16.79 | 8.11 | 3.77 | 6.68 | 2.63 | 1.92 | 4.02 | 2.78 | 1.64 | 1.06 |
| 1971 | 17.17 | 8.19 | 3.81 | 6.86 | 2.62 | 1.9 | 4.2 | 3.05 | 1.76 | 1.17 |
| 1970 | 16.4 | 7.81 | 3.53 | 6.55 | 2.51 | 1.8 | 3.8 | 2.73 | 1.61 | 0.99 |
| 1969 | 16.82 | 8.81 | 3.55 | 7.22 | 2.45 | 1.75 | 5.1 | 3.88 | 1.62 | 1.08 |
| 1968 | 16.13 | 8.27 | 3.27 | 6.87 | 2.33 | 1.7 | 4.84 | 3.73 | 1.48 | 0.91 |
| 1967 | 15.91 | 7.85 | 3.34 | 6.59 | 2.24 | 1.63 | 4.44 | 3.42 | 1.62 | 1.05 |
| 1966 | 15.02 | 7.41 | 3.03 | 6.41 | 1.89 | 1.35 | 4.47 | 3.37 | 1.59 | 1.11 |
| 1965 | 14.61 | 7.25 | 2.95 | 6.13 | 1.8 | 1.32 | 4.34 | 3.42 | 1.56 | 1.09 |
| 1964 | 14.36 | 7.17 | 2.85 | 6.04 | 1.72 | 1.29 | 4.32 | 3.29 | 1.48 | 1.05 |
| 1963 | 14.22 | 7.14 | 2.82 | 6.22 | 1.68 | 1.26 | 4.34 | 3.69 | 1.41 | 1.03 |
| 1962 | 14.01 | 7.51 | 2.65 | 6.49 | 1.61 | 1.23 | 4.87 | 4.12 | 1.25 | 0.94 |
| 1961 | 13.91 | 7.4 | 2.49 | 6.73 | 1.58 | 1.2 | 4.89 | 4.21 | 1.14 | 0.86 |


Comments