Abstract
Sweet potatoes have seen a significant increase in global trade, particularly in recent years. In 2021, the Netherlands emerged as the leading exporter, with 190,000 tons, reflecting its strong agricultural infrastructure and favorable climate for cultivation. Historically, the U.S. and China have been major players, with the U.S. focusing on both domestic consumption and exports, while China remains the largest producer overall. The growing demand for sweet potatoes in health-conscious markets, alongside rising interest in plant-based diets, has driven import trends. Additionally, the versatility of sweet potatoes in culinary applications has expanded their appeal globally, solidifying their position in international agriculture.
Sweet potato imports (worldwide)
Sweet potato imports have fluctuated significantly from 1961 to 2021, with Belgium-Luxembourg recording the highest import volume of 522,000 tons in 1991. This peak reflects a time when sweet potatoes gained popularity in European markets. However, by 2021, imports had dramatically declined to 192 million percent below this peak, indicating a substantial shift in consumer preferences and market dynamics. Other countries, such as the Netherlands and the U.S., have emerged as more consistent players in the global sweet potato trade. Factors contributing to these trends include changing dietary habits, increased interest in healthy foods, and variations in production capabilities. Overall, while sweet potatoes remain popular, their trade patterns illustrate evolving agricultural and economic landscapes.
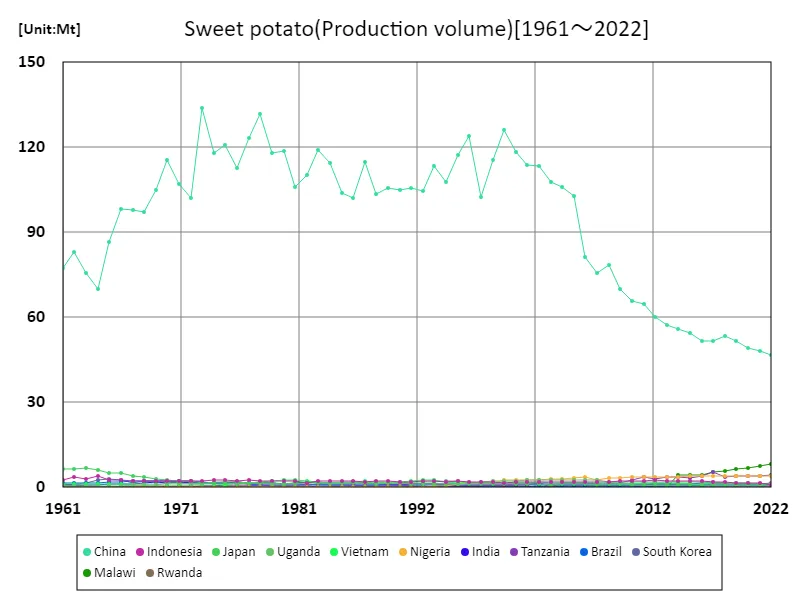
The maximum is 134Mt[1973] of China, and the current value is about 34.9%
Sweet potato imports (latest year, countries around the world)
In 2021, global sweet potato imports totaled 890,000 tons, with the Netherlands leading at 190,000 tons, highlighting its strong export capabilities. The average import volume across all countries was 6.01 tons, indicating that while a few nations dominate the market, many smaller imports contribute to the overall total. This year marked a notable trend towards increasing health consciousness among consumers, boosting demand for nutritious foods like sweet potatoes. Additionally, the versatility of sweet potatoes in various cuisines supports their growing popularity. As countries diversify their agricultural imports, sweet potatoes are likely to maintain a significant presence in global agriculture, driven by both health trends and culinary innovation.
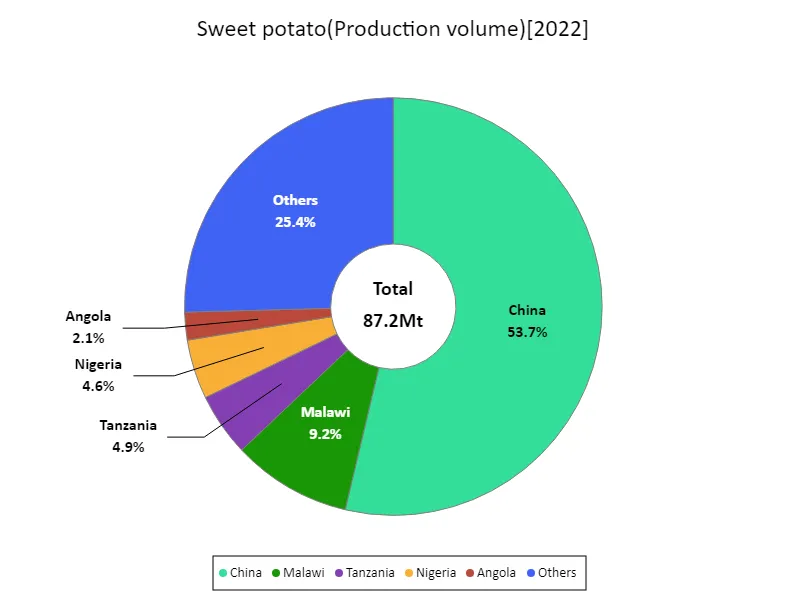
The maximum is 46.8Mt of China, the average is 758kt, and the total is 87.2Mt
Sweet potato imports (continent)
In 2021, Europe led global sweet potato imports, reaching 1.03 million tons, underscoring the region’s growing appreciation for this versatile tuber. This surge reflects a shift in dietary preferences, with consumers increasingly seeking healthier and plant-based food options. Countries like the Netherlands have emerged as key players in the market, while traditional producers like the U.S. and China continue to influence global trade dynamics. The rising interest in sweet potatoes can be attributed to their nutritional benefits, culinary versatility, and adaptability to various cuisines. As European markets evolve, sweet potatoes are likely to remain a staple in global agriculture, driven by health trends and increased consumer demand.
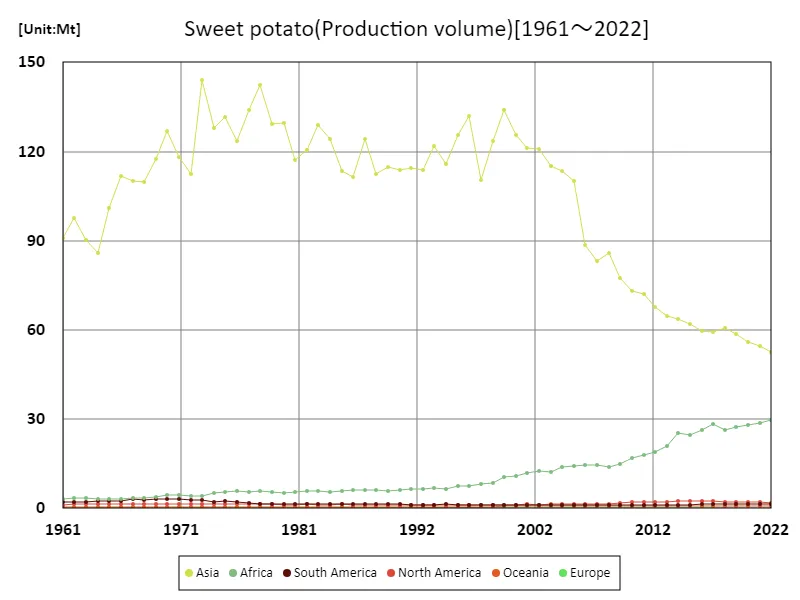
The maximum is 144Mt[1973] of Asia, and the current value is about 36.6%
Sweet potato imports (latest year, continent)
In 2021, Europe recorded sweet potato imports totaling 1.31 million tons, with a maximum of 594,000 tons, indicating a robust demand for this nutritious tuber. The average import volume was 164,000 tons, reflecting significant interest from various countries within the region. This trend highlights a shift in consumer preferences toward healthier, plant-based foods, as sweet potatoes are recognized for their nutritional benefits and culinary versatility. Major importing nations are adapting their agricultural strategies to accommodate this rising demand. As awareness of health and sustainability grows, sweet potatoes are likely to play an increasingly important role in global agriculture, particularly in European markets.
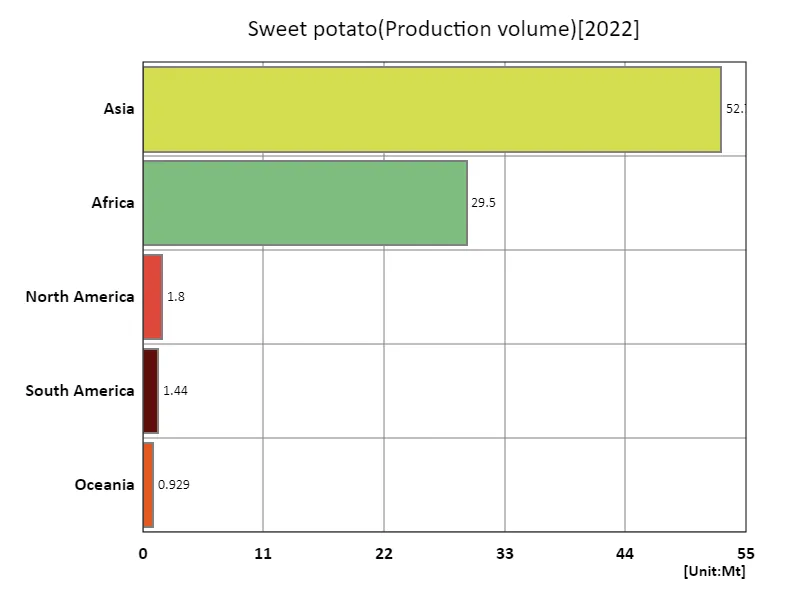
The maximum is 52.7Mt of Asia, the average is 17.3Mt, and the total is 86.4Mt
Main data
| Production(Sweet potato, Production volume, t) [Mt] | ||||||||||
|---|---|---|---|---|---|---|---|---|---|---|
| World | Asia | Upper-middle-income countries | Eastern Asia | China | Africa | Net Food Importing Developing Countries | Least Developed Countries | Low Income Food Deficit Countries | Eastern Africa | |
| 2022 | 86.41 | 52.71 | 49.54 | 48.44 | 46.83 | 29.53 | 26.08 | 24.05 | 23.27 | 19.34 |
| 2021 | 87.49 | 54.53 | 51.31 | 49.54 | 47.96 | 28.6 | 25.2 | 23 | 22.32 | 18.59 |
| 2020 | 88.52 | 56.02 | 52.55 | 50.71 | 49.14 | 28.17 | 24.7 | 22.63 | 21.98 | 18.27 |
| 2019 | 90.77 | 58.69 | 55.3 | 53.44 | 51.75 | 27.5 | 24.26 | 21.77 | 21.54 | 18.17 |
| 2018 | 91.53 | 60.81 | 57.03 | 54.97 | 53.25 | 26.34 | 23.13 | 20.65 | 20.23 | 16.87 |
| 2017 | 92.45 | 59.14 | 55.56 | 53.27 | 51.69 | 28.49 | 25.35 | 23.17 | 22.37 | 18.82 |
| 2016 | 90.38 | 59.58 | 55.72 | 53.52 | 51.63 | 26.17 | 23.27 | 20.97 | 20.03 | 16.86 |
| 2015 | 91.32 | 62.03 | 58.52 | 55.96 | 54.43 | 24.69 | 22 | 19.29 | 18.7 | 15.82 |
| 2014 | 93.49 | 63.62 | 60.09 | 57.62 | 56.02 | 25.25 | 22.88 | 20.71 | 19.62 | 16.57 |
| 2013 | 90.18 | 64.83 | 61.09 | 58.83 | 57.11 | 21.02 | 18.69 | 16.62 | 16.25 | 12.78 |
| 2012 | 90.72 | 67.7 | 64 | 61.61 | 60.01 | 18.79 | 16.45 | 14.37 | 14.62 | 11.23 |
| 2011 | 94.47 | 72.21 | 68.59 | 66.43 | 64.85 | 18.04 | 15.81 | 13.91 | 13.61 | 10.65 |
| 2010 | 93.89 | 73.03 | 69.41 | 67.4 | 65.81 | 16.86 | 14.65 | 12.56 | 12.28 | 9.78 |
| 2009 | 96.16 | 77.49 | 73.63 | 71.81 | 70.04 | 14.98 | 13 | 10.68 | 10.49 | 8.47 |
| 2008 | 103.18 | 85.71 | 81.8 | 80.16 | 78.44 | 13.96 | 11.72 | 9.77 | 9.74 | 7.66 |
| 2007 | 101.19 | 83.12 | 79.27 | 77.49 | 75.8 | 14.5 | 13.2 | 11.2 | 10.96 | 8.89 |
| 2006 | 106.63 | 88.51 | 84.63 | 82.91 | 81.27 | 14.71 | 12.24 | 10.45 | 10.37 | 8.45 |
| 2005 | 127.73 | 110.16 | 106.24 | 104.43 | 102.75 | 14.11 | 12.08 | 10.22 | 10.09 | 8.32 |
| 2004 | 130.71 | 113.34 | 109.47 | 107.55 | 105.84 | 13.86 | 12.03 | 10.34 | 10.11 | 8.5 |
| 2003 | 130.93 | 115.26 | 111.45 | 109.31 | 107.75 | 12.19 | 10.68 | 8.89 | 8.7 | 7.08 |
| 2002 | 136.73 | 120.84 | 116.67 | 114.99 | 113.3 | 12.7 | 11.26 | 9.7 | 9.6 | 8.07 |
| 2001 | 136.13 | 121.04 | 117.11 | 115.44 | 113.78 | 11.81 | 10.52 | 8.79 | 8.83 | 7.38 |
| 2000 | 139.71 | 125.68 | 121.45 | 119.89 | 118.18 | 10.95 | 9.64 | 8.1 | 8.17 | 6.74 |
| 1999 | 147.21 | 133.83 | 129.17 | 128.07 | 126.14 | 10.45 | 9.08 | 7.55 | 7.92 | 6.27 |
| 1998 | 134.82 | 123.37 | 118.96 | 117.54 | 115.64 | 8.56 | 8.1 | 6.77 | 6.87 | 5.39 |
| 1997 | 121.32 | 110.29 | 105.79 | 104.34 | 102.62 | 8.14 | 7.74 | 6.5 | 6.44 | 5.01 |
| 1996 | 142 | 131.81 | 127.24 | 125.58 | 123.96 | 7.37 | 6.97 | 5.96 | 5.63 | 4.35 |
| 1995 | 135.99 | 125.43 | 121.01 | 119.01 | 117.38 | 7.56 | 7.56 | 6.49 | 6.17 | 4.94 |
| 1994 | 125.48 | 115.78 | 111.06 | 109.35 | 107.65 | 6.6 | 7.48 | 6.49 | 6.13 | 4.88 |
| 1993 | 131.54 | 121.91 | 116.82 | 114.79 | 113.34 | 6.76 | 7.58 | 6.55 | 6.19 | 5 |
| 1992 | 123.23 | 113.86 | 108.26 | 106.54 | 104.64 | 6.38 | 7.47 | 6.49 | 6.18 | 4.88 |
| 1991 | 123.7 | 114.36 | 109.02 | 107.46 | 105.62 | 6.46 | 7.51 | 6.42 | 6.22 | 4.98 |
| 1990 | 122.77 | 113.69 | 108.35 | 106.99 | 104.9 | 6.06 | 7.23 | 6.26 | 5.91 | 4.58 |
| 1989 | 123.72 | 114.88 | 109.38 | 107.92 | 105.65 | 5.77 | 6.97 | 6.09 | 5.72 | 4.43 |
| 1988 | 121.96 | 112.59 | 107.19 | 105.6 | 103.46 | 6.14 | 7.41 | 6.23 | 6.05 | 4.73 |
| 1987 | 133.65 | 124.26 | 118.3 | 117 | 114.79 | 6.11 | 7.31 | 6.18 | 6.12 | 4.81 |
| 1986 | 120.95 | 111.5 | 105.57 | 104.44 | 102.01 | 6.16 | 7.45 | 6.3 | 6.17 | 4.89 |
| 1985 | 122.99 | 113.6 | 107.38 | 106.35 | 103.8 | 5.98 | 7.42 | 6.24 | 6 | 4.69 |
| 1984 | 133.03 | 124.25 | 118.12 | 117.13 | 114.61 | 5.42 | 7.01 | 6 | 5.49 | 4.16 |
| 1983 | 137.94 | 129.06 | 122.34 | 121.61 | 119.02 | 5.67 | 7.26 | 6.32 | 5.73 | 4.46 |
| 1982 | 129.43 | 120.39 | 112.96 | 112.72 | 110.29 | 5.69 | 7.15 | 5.91 | 5.68 | 4.44 |
| 1981 | 125.54 | 117.01 | 108.94 | 108.77 | 106.01 | 5.36 | 6.87 | 5.79 | 5.35 | 4.16 |
| 1980 | 137.87 | 129.44 | 121.61 | 121.45 | 118.85 | 5.28 | 6.85 | 5.78 | 5.26 | 4.08 |
| 1979 | 137.93 | 129.09 | 120.86 | 120.84 | 117.91 | 5.38 | 7.04 | 5.85 | 5.33 | 4.14 |
| 1978 | 151.85 | 142.48 | 134.29 | 134.78 | 131.6 | 5.78 | 7.47 | 6.3 | 5.81 | 4.6 |
| 1977 | 143.1 | 134 | 126.33 | 126.52 | 123.35 | 5.37 | 6.97 | 5.96 | 5.43 | 4.17 |
| 1976 | 133.32 | 123.43 | 115.65 | 115.79 | 112.55 | 5.77 | 7.44 | 6.37 | 5.79 | 4.55 |
| 1975 | 141.31 | 131.5 | 123.76 | 124.44 | 120.91 | 5.45 | 7.02 | 5.9 | 5.44 | 4.26 |
| 1974 | 137.26 | 128 | 120.37 | 121.03 | 117.99 | 5.03 | 6.45 | 5.39 | 5.01 | 3.86 |
| 1973 | 152.86 | 144.01 | 136.32 | 137.44 | 134.01 | 4.3 | 5.7 | 4.72 | 4.27 | 3.16 |
| 1972 | 121.46 | 112.43 | 104.67 | 106.11 | 102.03 | 4.16 | 5.56 | 4.58 | 4.08 | 2.99 |
| 1971 | 127.25 | 117.99 | 109.4 | 111.22 | 107.04 | 4.37 | 5.9 | 4.92 | 4.3 | 3.22 |
| 1970 | 136.5 | 127.02 | 117.58 | 120.28 | 115.34 | 4.58 | 6.09 | 5.12 | 4.49 | 3.39 |
| 1969 | 126.16 | 117.41 | 107.12 | 110.23 | 105.01 | 3.78 | 5.17 | 4.22 | 3.6 | 2.54 |
| 1968 | 118.09 | 109.77 | 99.37 | 103 | 97.1 | 3.62 | 4.97 | 4.06 | 3.47 | 2.43 |
| 1967 | 118.61 | 110.12 | 99.99 | 103.91 | 97.98 | 3.57 | 4.86 | 3.98 | 3.41 | 2.4 |
| 1966 | 119.68 | 111.93 | 100.41 | 105.99 | 98.22 | 3.23 | 4.24 | 3.35 | 3.07 | 2.12 |
| 1965 | 108.37 | 100.86 | 88.91 | 94.6 | 86.45 | 3.18 | 4.15 | 3.29 | 3 | 2.08 |
| 1964 | 93.37 | 85.96 | 73.35 | 78.58 | 69.87 | 3.24 | 4.24 | 3.33 | 3.05 | 2.1 |
| 1963 | 98 | 90.4 | 79.48 | 84.03 | 75.78 | 3.42 | 4.33 | 3.48 | 3.25 | 2.26 |
| 1962 | 105.29 | 97.63 | 86.32 | 90.7 | 83.11 | 3.57 | 4.38 | 3.6 | 3.41 | 2.39 |
| 1961 | 98.19 | 91.07 | 78.98 | 84.83 | 77.29 | 3.28 | 4 | 3.28 | 3.12 | 2.13 |


Comments