Abstract
Onion export volume is an important agricultural indicator globally, and the latest data for 2021 reveals that the Netherlands is the largest exporter. The Netherlands recorded an export volume of 1.69 megatons and plays a leading role in the global onion market. This is likely the result of the Netherlands’ long-standing focus on agricultural innovation and the establishment of advanced cultivation techniques and efficient production systems. In addition, the Netherlands’ climatic conditions and proper planning of land use are also cited as factors that make it suitable for onion cultivation. Other major exporting countries include China, India, and Spain. These countries also utilize their agricultural production capacity and export infrastructure to maintain their competitiveness in the global market. On the other hand, factors such as climate change and natural disasters may affect onion production. To address this, the adoption of sustainable agricultural practices and the promotion of technological innovation will be important challenges in future global onion production.
Onion export volume (worldwide)
Looking at onion export data, long-term changes and characteristics emerge. From 1961 to 2021, India achieved the highest export volume of 1.84 megatons in 2016. However, the latest data shows that the peak export volume has decreased to 78.1%. This is likely due to increased competition in the onion market and the emergence of other major producing countries. Climate change and natural disasters may also be affecting export volumes. On the other hand, there is a trend of other countries increasing their export volumes. This is due to advances in agricultural technology, improved production efficiency, and the development of export infrastructure. The global onion market is influenced by many factors, including competition and demand changes between countries, as well as environmental factors. In the future, promoting sustainable agricultural practices and building production systems that meet market needs will be important challenges for onion producing countries.
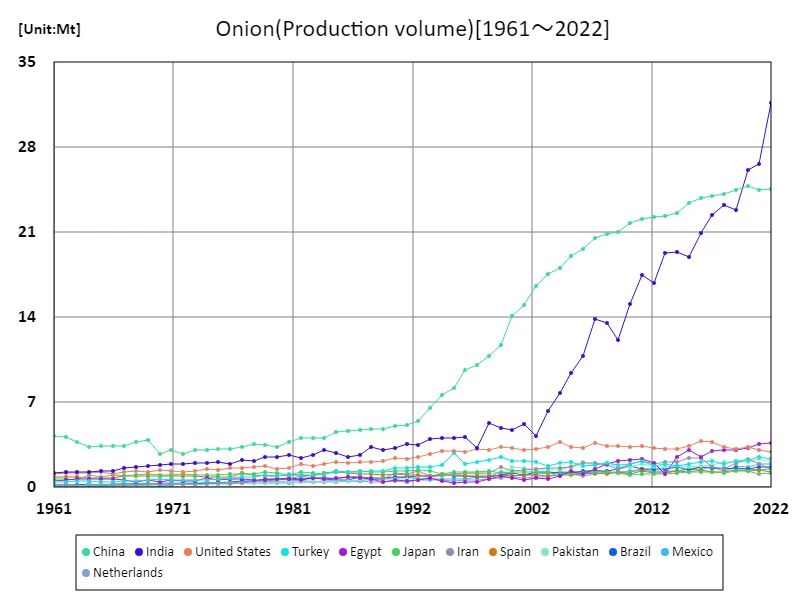
The maximum is the latest one, 31.7Mt of India
Onion export volume (latest year, countries around the world)
When considering the 2021 data on the export volume of the agricultural crop onion, several features emerge. First, the Netherlands maintains the top position in the world with an overwhelming export volume of 1.69 megatons. Over the years, the Netherlands has established advanced agricultural techniques and efficient production systems, establishing a leading position in the onion market. In addition, the average export volume of 68.8 kilotons suggests that the international market for onions is relatively stable. Furthermore, the overall export volume of 8.54 megatons suggests that onions are an important agricultural crop globally. This figure indicates that many countries consider onions to be a major export item. On the other hand, there is variation in the production capacity and export volumes of each country, and the situation remains highly competitive. It is also important to consider that factors such as climate change and natural disasters affect production. In light of these factors, promoting sustainable agricultural practices and building production systems in line with market demand will be important challenges for onion-producing countries around the world.
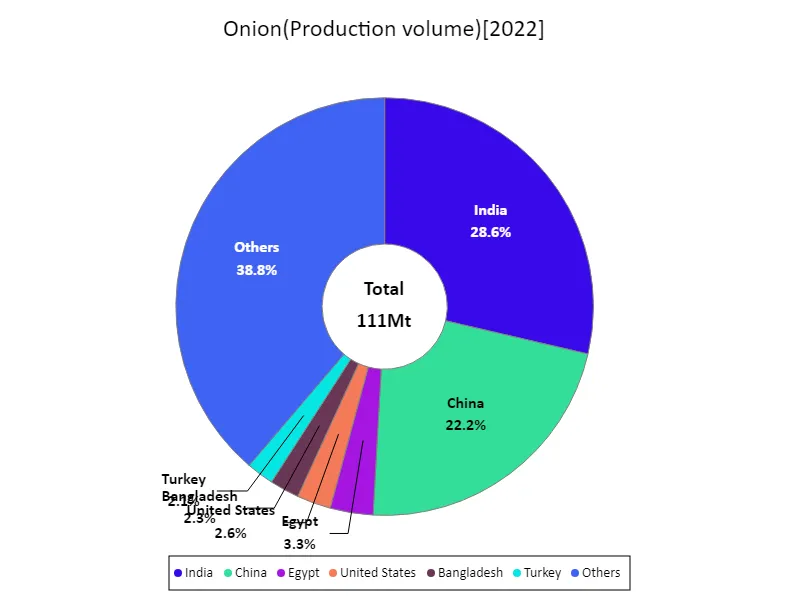
The maximum is 31.7Mt of India, the average is 774kt, and the total is 111Mt
Onion export volume (continent)
Analyzing the export volume data for the agricultural crop onion in 2021, some noteworthy features can be seen. First, the maximum overall export volume was 4.07 megatons, which is the highest value ever recorded. This figure suggests that the international market for onions is expanding. In particular, the Asian region showed the largest export volume, indicating an improvement in agricultural power and production efficiency throughout the region. This reflects the fact that Asian countries are focusing on onion production and export. In addition, the increase in global food demand and the expansion of demand due to economic growth may contribute to the expansion of the onion market. On the other hand, onion export volumes are also affected by seasonal fluctuations and climate change. In light of these factors, establishing a sustainable agricultural production system and strengthening risk management will be important issues for onion-producing countries. In addition, as market competition intensifies, improving quality control and price competitiveness will also be important issues.
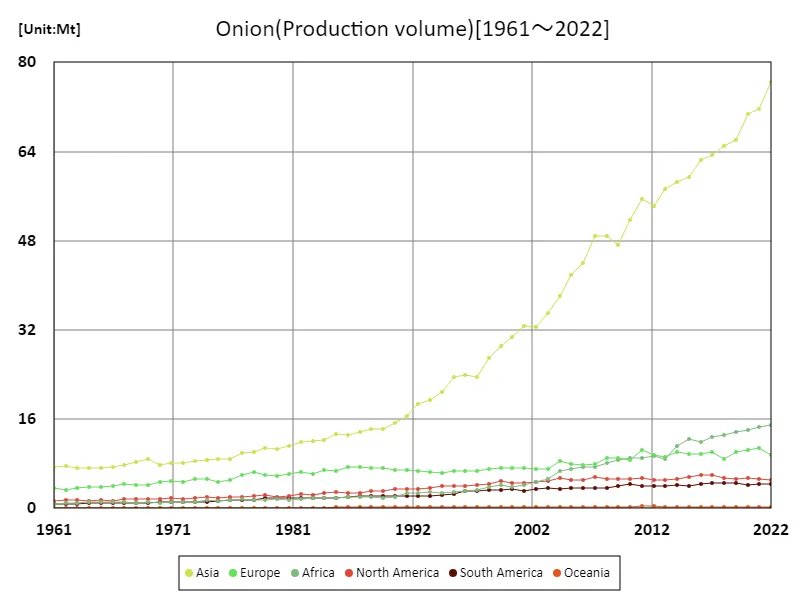
The maximum is the latest one, 76.4Mt of Asia
Onion export volume (latest year, continent)
Based on the export volume data for the agricultural crop onion in 2021, several characteristics emerge. First, Asia is the region with the largest overall export volume, and the figure of 3.92 megatons is evidence of this. This shows that Asian countries play a leading role in onion production and export. It is believed that the improvement of agricultural capacity and production efficiency in the Asian region contribute to this achievement. On the other hand, the overall average export volume of 1.42 megatons suggests that the onion market has different characteristics in each region. This is likely due to differences in climatic conditions and land use, as well as differences in production systems. In addition, the overall export volume of 8.54 megatons reaffirms that onions are a globally important agricultural crop. This shows that many countries consider onions to be a major export item. In addition, factors such as climate change and natural disasters affect production, which should be taken into consideration. In light of these factors, promoting sustainable agricultural practices and building production systems in line with market demand will be important challenges for onion-producing countries around the world.
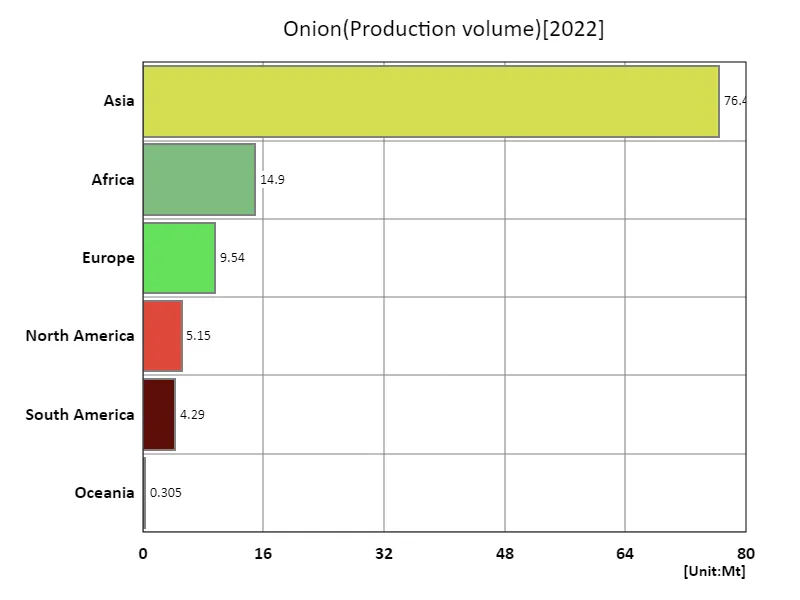
The maximum is 76.4Mt of Asia, the average is 18.4Mt, and the total is 111Mt
Main data
| Production(Onion, Production volume, t) [Mt] | ||||||||||
|---|---|---|---|---|---|---|---|---|---|---|
| World | Asia | Lower-middle-income countries | Upper-middle-income countries | Southern Asia | India | Eastern Asia | China | Net Food Importing Developing Countries | Africa | |
| 2022 | 110.62 | 76.43 | 52.54 | 39.16 | 38.77 | 31.69 | 27.12 | 24.61 | 17.57 | 14.9 |
| 2021 | 106.75 | 71.7 | 47.6 | 39.06 | 33.79 | 26.64 | 27.27 | 24.49 | 17.4 | 14.52 |
| 2020 | 105.11 | 70.66 | 46.62 | 39.08 | 32.97 | 26.09 | 27.44 | 24.82 | 16.36 | 14.08 |
| 2019 | 100.08 | 66.14 | 42.31 | 38.58 | 29.11 | 22.82 | 27.53 | 24.5 | 15.86 | 13.72 |
| 2018 | 97.41 | 65.04 | 42.12 | 37.79 | 28.89 | 23.26 | 26.95 | 24.18 | 15.32 | 13.22 |
| 2017 | 97.08 | 63.39 | 40.4 | 38.15 | 28.15 | 22.43 | 26.5 | 24.03 | 14.98 | 12.75 |
| 2016 | 94.84 | 62.45 | 39.13 | 37.4 | 27.07 | 20.93 | 26.43 | 23.79 | 14.03 | 11.93 |
| 2015 | 91.57 | 59.47 | 37.73 | 36.55 | 25.06 | 18.93 | 25.89 | 23.44 | 14.75 | 12.4 |
| 2014 | 89.45 | 58.56 | 36.67 | 35.51 | 24.96 | 19.4 | 25.45 | 22.59 | 13.54 | 11.18 |
| 2013 | 84.77 | 57.31 | 34.31 | 34.73 | 24.53 | 19.3 | 24.81 | 22.35 | 11.28 | 8.9 |
| 2012 | 82.56 | 54.18 | 32.28 | 34.56 | 22.01 | 16.81 | 24.63 | 22.24 | 11.84 | 9.3 |
| 2011 | 84.67 | 55.5 | 33.04 | 35.02 | 23.08 | 17.51 | 24.74 | 22.06 | 12.19 | 8.99 |
| 2010 | 79.14 | 51.63 | 29.77 | 33.88 | 20.05 | 15.12 | 24.29 | 21.75 | 11.43 | 9.08 |
| 2009 | 74.37 | 47.21 | 25.96 | 32.59 | 16.59 | 12.16 | 23.66 | 21.05 | 10.96 | 8.64 |
| 2008 | 75.01 | 48.84 | 27.51 | 32.41 | 18.79 | 13.57 | 23.22 | 20.82 | 10.86 | 8.1 |
| 2007 | 73.79 | 48.86 | 26.97 | 31.5 | 19.16 | 13.9 | 23.13 | 20.57 | 10.22 | 7.49 |
| 2006 | 68.17 | 44.05 | 23.38 | 30.05 | 16.26 | 10.85 | 21.74 | 19.6 | 10.28 | 7.38 |
| 2005 | 65.76 | 41.81 | 21.11 | 29.64 | 14.03 | 9.43 | 21.25 | 19.05 | 9.63 | 7.11 |
| 2004 | 62.45 | 38.09 | 18.14 | 28.47 | 11.66 | 7.76 | 20.21 | 18.05 | 8.41 | 6.69 |
| 2003 | 56.29 | 35.1 | 15.06 | 27.5 | 9.99 | 6.27 | 19.54 | 17.54 | 7.32 | 5.33 |
| 2002 | 52.75 | 32.54 | 12.75 | 26.49 | 7.86 | 4.21 | 18.84 | 16.54 | 6.82 | 4.75 |
| 2001 | 52.03 | 32.72 | 13.74 | 24.96 | 8.98 | 5.25 | 17.44 | 15.02 | 6.36 | 4.18 |
| 2000 | 49.96 | 30.67 | 12.94 | 23.87 | 8.5 | 4.72 | 16.31 | 14.1 | 6.04 | 3.74 |
| 1999 | 49.04 | 29.04 | 13.2 | 22.43 | 8.56 | 4.9 | 13.95 | 11.73 | 5.76 | 4.2 |
| 1998 | 45.68 | 26.93 | 12.35 | 20.47 | 8.44 | 5.33 | 13.15 | 10.84 | 5.37 | 3.9 |
| 1997 | 40.98 | 23.51 | 9.67 | 19.08 | 6.36 | 3.2 | 12.12 | 10.04 | 4.66 | 3.36 |
| 1996 | 41.05 | 23.96 | 10.54 | 18.3 | 7.36 | 4.18 | 11.57 | 9.64 | 4.35 | 3.08 |
| 1995 | 39.81 | 23.49 | 10.27 | 17.01 | 7.16 | 4.08 | 10.53 | 8.2 | 4.05 | 2.89 |
| 1994 | 36.44 | 20.81 | 10.01 | 15.01 | 7.03 | 4.04 | 9.36 | 7.63 | 4.04 | 2.82 |
| 1993 | 34.8 | 19.35 | 9.9 | 13.48 | 6.8 | 4.01 | 8.53 | 6.53 | 4.15 | 2.97 |
| 1992 | 34.02 | 18.72 | 10.03 | 12.84 | 6.62 | 3.49 | 7.72 | 5.43 | 3.97 | 2.71 |
| 1991 | 32.03 | 16.55 | 8.12 | 13.41 | 6.42 | 3.58 | 7.06 | 5.14 | 3.88 | 2.82 |
| 1990 | 30.1 | 15.3 | 7.18 | 13.31 | 5.36 | 3.23 | 6.84 | 5.03 | 2.99 | 2.09 |
| 1989 | 28.87 | 14.22 | 6.43 | 12.88 | 4.68 | 3.07 | 6.73 | 4.82 | 2.81 | 1.88 |
| 1988 | 28.9 | 14.21 | 6.69 | 12.95 | 4.79 | 3.35 | 6.67 | 4.82 | 2.79 | 1.97 |
| 1987 | 28.37 | 13.77 | 6.39 | 12.68 | 4.39 | 2.7 | 6.63 | 4.73 | 2.78 | 2.01 |
| 1986 | 27.45 | 13.19 | 6.15 | 12.42 | 4.07 | 2.53 | 6.33 | 4.63 | 2.82 | 2.06 |
| 1985 | 26.8 | 13.34 | 6.13 | 11.47 | 4.28 | 2.86 | 6.37 | 4.53 | 2.58 | 1.87 |
| 1984 | 25.68 | 12.32 | 6.39 | 10.73 | 4.62 | 3.1 | 5.37 | 4.04 | 2.44 | 1.81 |
| 1983 | 24.37 | 12.08 | 5.78 | 10.34 | 4.15 | 2.7 | 5.78 | 4.02 | 2.49 | 1.78 |
| 1982 | 24.63 | 11.94 | 5.61 | 10.33 | 4.04 | 2.43 | 5.78 | 4.04 | 2.36 | 1.66 |
| 1981 | 23 | 11.23 | 5.36 | 9.82 | 3.93 | 2.65 | 5.13 | 3.77 | 2.15 | 1.57 |
| 1980 | 22 | 10.57 | 5.31 | 9.22 | 3.78 | 2.5 | 4.74 | 3.28 | 2.32 | 1.6 |
| 1979 | 22.58 | 10.83 | 4.97 | 9.53 | 3.61 | 2.5 | 5.15 | 3.47 | 2.13 | 1.5 |
| 1978 | 21.86 | 10.1 | 4.69 | 9.17 | 3.24 | 2.2 | 4.85 | 3.54 | 2.04 | 1.45 |
| 1977 | 21 | 9.84 | 4.71 | 8.38 | 3.15 | 2.23 | 4.75 | 3.35 | 2.13 | 1.58 |
| 1976 | 19.08 | 8.93 | 4.24 | 8.02 | 2.82 | 1.95 | 4.43 | 3.16 | 2.07 | 1.53 |
| 1975 | 18.35 | 8.86 | 4.28 | 7.62 | 2.93 | 2.1 | 4.3 | 3.16 | 1.87 | 1.37 |
| 1974 | 18.79 | 8.72 | 4.19 | 7.69 | 2.75 | 2 | 4.24 | 3.07 | 1.91 | 1.42 |
| 1973 | 17.83 | 8.43 | 3.89 | 7.52 | 2.68 | 1.98 | 4.14 | 3.03 | 1.62 | 1.16 |
| 1972 | 16.79 | 8.11 | 3.77 | 6.68 | 2.63 | 1.92 | 4.02 | 2.78 | 1.64 | 1.06 |
| 1971 | 17.17 | 8.19 | 3.81 | 6.86 | 2.62 | 1.9 | 4.2 | 3.05 | 1.76 | 1.17 |
| 1970 | 16.4 | 7.81 | 3.53 | 6.55 | 2.51 | 1.8 | 3.8 | 2.73 | 1.61 | 0.99 |
| 1969 | 16.82 | 8.81 | 3.55 | 7.22 | 2.45 | 1.75 | 5.1 | 3.88 | 1.62 | 1.08 |
| 1968 | 16.13 | 8.27 | 3.27 | 6.87 | 2.33 | 1.7 | 4.84 | 3.73 | 1.48 | 0.91 |
| 1967 | 15.91 | 7.85 | 3.34 | 6.59 | 2.24 | 1.63 | 4.44 | 3.42 | 1.62 | 1.05 |
| 1966 | 15.02 | 7.41 | 3.03 | 6.41 | 1.89 | 1.35 | 4.47 | 3.37 | 1.59 | 1.11 |
| 1965 | 14.61 | 7.25 | 2.95 | 6.13 | 1.8 | 1.32 | 4.34 | 3.42 | 1.56 | 1.09 |
| 1964 | 14.36 | 7.17 | 2.85 | 6.04 | 1.72 | 1.29 | 4.32 | 3.29 | 1.48 | 1.05 |
| 1963 | 14.22 | 7.14 | 2.82 | 6.22 | 1.68 | 1.26 | 4.34 | 3.69 | 1.41 | 1.03 |
| 1962 | 14.01 | 7.51 | 2.65 | 6.49 | 1.61 | 1.23 | 4.87 | 4.12 | 1.25 | 0.94 |
| 1961 | 13.91 | 7.4 | 2.49 | 6.73 | 1.58 | 1.2 | 4.89 | 4.21 | 1.14 | 0.86 |

Comments