
Abstract
The global sweet potato export market has seen significant growth, particularly in the last two decades, driven by increasing demand for healthier and versatile food options. Historically, the United States has been a key player in this market, consistently leading in export volumes, as evidenced by its 2021 figure of 271 kt. This dominance is largely due to favorable growing conditions, technological advancements, and increased production in states like North Carolina. Other major exporters include China and European nations, though their volumes trail behind the U.S. Trends also show an expansion in sweet potato exports to Europe, where consumers are increasingly incorporating them into their diets for health benefits. These factors underline the crop’s global economic significance.
Sweet potato export volume (worldwide)
From 1961 to 2021, the global sweet potato export market has been dominated by China, which reached its peak export volume of 779 kt in 1991. However, China’s current exports are 3.21% below this peak, reflecting a slight decline over the decades. Despite this, China remains a key player in the global market. During its peak, China benefited from strong domestic production and growing demand from neighboring countries. Since the 1990s, there has been a shift, with other countries, particularly the U.S., increasing their exports. This trend suggests diversification in global sweet potato trade, driven by changing consumption patterns and growing health-consciousness worldwide.
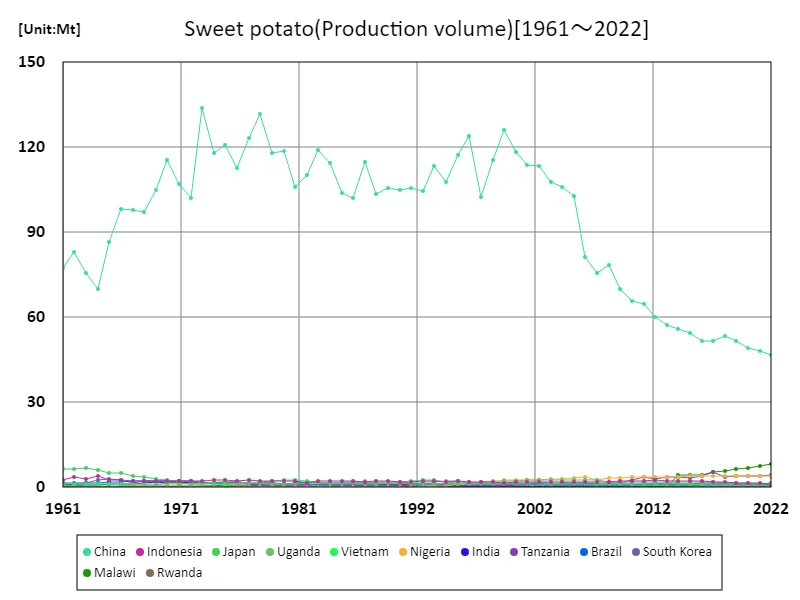
The maximum is 134Mt[1973] of China, and the current value is about 34.9%
Sweet potato export volume (latest year, countries around the world)
In 2021, global sweet potato exports reached a total of 862 kt, with the United States leading at 271 kt, highlighting its significant role in the market. This marked a notable trend where U.S. exports dominate, supported by favorable growing conditions and advancements in agricultural practices, particularly in North Carolina. The average export volume across other countries was considerably lower at 7.7 kt, indicating that sweet potato production and trade are concentrated among a few key players. The growing interest in healthier food options has contributed to increased demand, particularly in markets such as Europe and Asia. Overall, these trends illustrate sweet potatoes’ rising profile in global agriculture, driven by health trends and diversification in culinary applications.
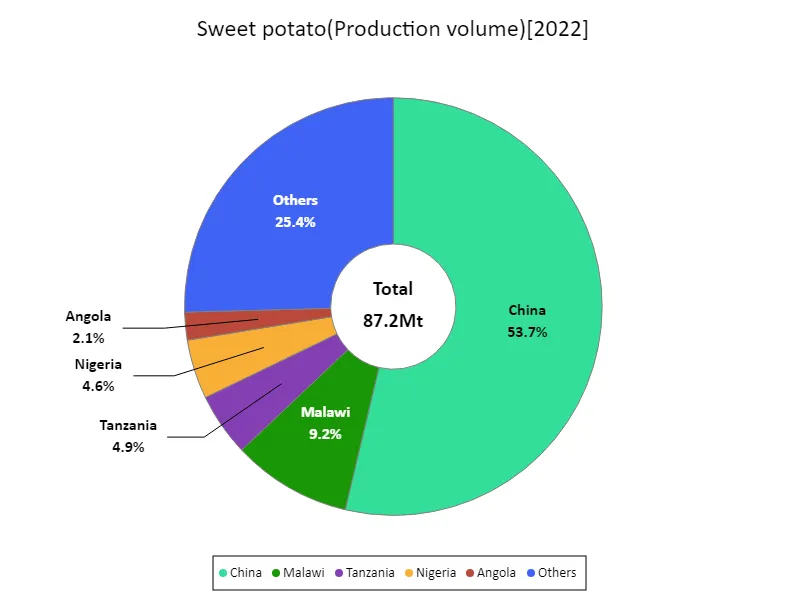
The maximum is 46.8Mt of China, the average is 758kt, and the total is 87.2Mt
Sweet potato export volume (continent)
In 2021, Asia emerged as the leading region in sweet potato exports, reaching a total of 782 kt, which reflects the crop’s significance in the region’s agricultural landscape. Historically, sweet potatoes have been a staple in many Asian diets, particularly in countries like China and Japan. The rise in export volumes is attributed to growing global demand for healthier food options and the versatility of sweet potatoes in various cuisines. Additionally, advancements in agricultural techniques and increased production capabilities have further boosted export potential. As awareness of the nutritional benefits of sweet potatoes grows, Asia’s dominance in the market is likely to continue, driving further trends in global trade and consumption.
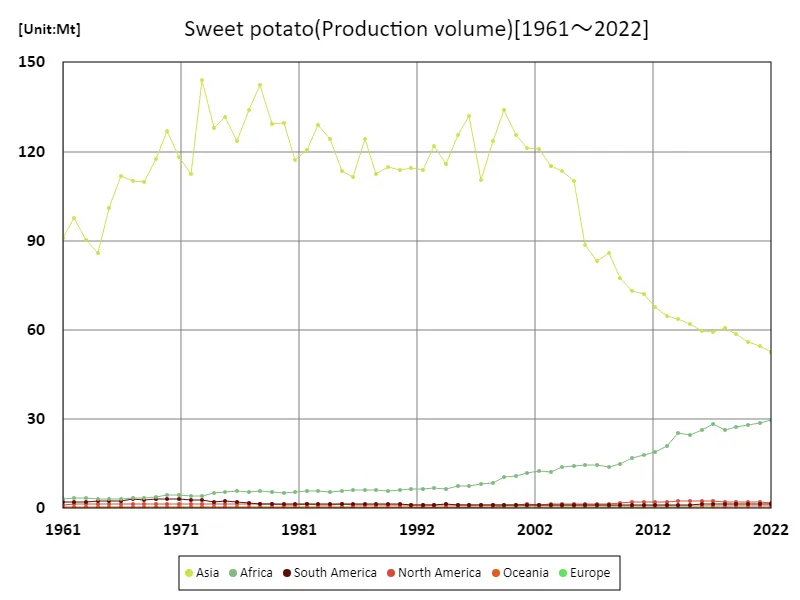
The maximum is 144Mt[1973] of Asia, and the current value is about 36.6%
Sweet potato export volume (latest year, continent)
In 2021, North America led the global sweet potato export market with a significant volume of 357 kt, highlighting its dominant position in production and trade. The total global export volume reached 866 kt, with an average export volume of 144 kt, indicating a concentration of trade among key exporters. The growth in North American exports is attributed to favorable climate conditions, advanced agricultural practices, and increasing consumer demand for healthy, versatile foods. As sweet potatoes gain popularity for their nutritional benefits and culinary versatility, the market is expected to expand. This trend suggests a continued emphasis on health-conscious eating, driving both production and export growth in the years to come.
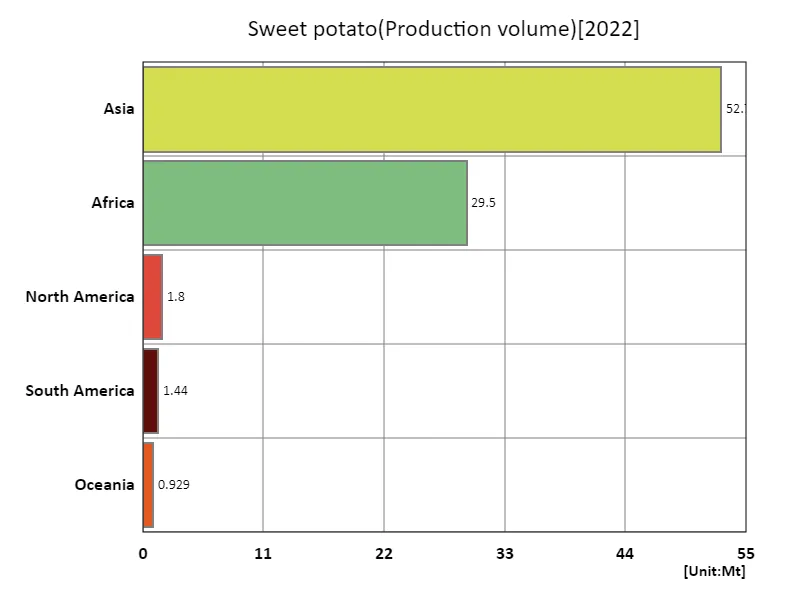
The maximum is 52.7Mt of Asia, the average is 17.3Mt, and the total is 86.4Mt
Main data
| Production(Sweet potato, Production volume, t) [Mt] | ||||||||||
|---|---|---|---|---|---|---|---|---|---|---|
| World | Asia | Upper-middle-income countries | Eastern Asia | China | Africa | Net Food Importing Developing Countries | Least Developed Countries | Low Income Food Deficit Countries | Eastern Africa | |
| 2022 | 86.41 | 52.71 | 49.54 | 48.44 | 46.83 | 29.53 | 26.08 | 24.05 | 23.27 | 19.34 |
| 2021 | 87.49 | 54.53 | 51.31 | 49.54 | 47.96 | 28.6 | 25.2 | 23 | 22.32 | 18.59 |
| 2020 | 88.52 | 56.02 | 52.55 | 50.71 | 49.14 | 28.17 | 24.7 | 22.63 | 21.98 | 18.27 |
| 2019 | 90.77 | 58.69 | 55.3 | 53.44 | 51.75 | 27.5 | 24.26 | 21.77 | 21.54 | 18.17 |
| 2018 | 91.53 | 60.81 | 57.03 | 54.97 | 53.25 | 26.34 | 23.13 | 20.65 | 20.23 | 16.87 |
| 2017 | 92.45 | 59.14 | 55.56 | 53.27 | 51.69 | 28.49 | 25.35 | 23.17 | 22.37 | 18.82 |
| 2016 | 90.38 | 59.58 | 55.72 | 53.52 | 51.63 | 26.17 | 23.27 | 20.97 | 20.03 | 16.86 |
| 2015 | 91.32 | 62.03 | 58.52 | 55.96 | 54.43 | 24.69 | 22 | 19.29 | 18.7 | 15.82 |
| 2014 | 93.49 | 63.62 | 60.09 | 57.62 | 56.02 | 25.25 | 22.88 | 20.71 | 19.62 | 16.57 |
| 2013 | 90.18 | 64.83 | 61.09 | 58.83 | 57.11 | 21.02 | 18.69 | 16.62 | 16.25 | 12.78 |
| 2012 | 90.72 | 67.7 | 64 | 61.61 | 60.01 | 18.79 | 16.45 | 14.37 | 14.62 | 11.23 |
| 2011 | 94.47 | 72.21 | 68.59 | 66.43 | 64.85 | 18.04 | 15.81 | 13.91 | 13.61 | 10.65 |
| 2010 | 93.89 | 73.03 | 69.41 | 67.4 | 65.81 | 16.86 | 14.65 | 12.56 | 12.28 | 9.78 |
| 2009 | 96.16 | 77.49 | 73.63 | 71.81 | 70.04 | 14.98 | 13 | 10.68 | 10.49 | 8.47 |
| 2008 | 103.18 | 85.71 | 81.8 | 80.16 | 78.44 | 13.96 | 11.72 | 9.77 | 9.74 | 7.66 |
| 2007 | 101.19 | 83.12 | 79.27 | 77.49 | 75.8 | 14.5 | 13.2 | 11.2 | 10.96 | 8.89 |
| 2006 | 106.63 | 88.51 | 84.63 | 82.91 | 81.27 | 14.71 | 12.24 | 10.45 | 10.37 | 8.45 |
| 2005 | 127.73 | 110.16 | 106.24 | 104.43 | 102.75 | 14.11 | 12.08 | 10.22 | 10.09 | 8.32 |
| 2004 | 130.71 | 113.34 | 109.47 | 107.55 | 105.84 | 13.86 | 12.03 | 10.34 | 10.11 | 8.5 |
| 2003 | 130.93 | 115.26 | 111.45 | 109.31 | 107.75 | 12.19 | 10.68 | 8.89 | 8.7 | 7.08 |
| 2002 | 136.73 | 120.84 | 116.67 | 114.99 | 113.3 | 12.7 | 11.26 | 9.7 | 9.6 | 8.07 |
| 2001 | 136.13 | 121.04 | 117.11 | 115.44 | 113.78 | 11.81 | 10.52 | 8.79 | 8.83 | 7.38 |
| 2000 | 139.71 | 125.68 | 121.45 | 119.89 | 118.18 | 10.95 | 9.64 | 8.1 | 8.17 | 6.74 |
| 1999 | 147.21 | 133.83 | 129.17 | 128.07 | 126.14 | 10.45 | 9.08 | 7.55 | 7.92 | 6.27 |
| 1998 | 134.82 | 123.37 | 118.96 | 117.54 | 115.64 | 8.56 | 8.1 | 6.77 | 6.87 | 5.39 |
| 1997 | 121.32 | 110.29 | 105.79 | 104.34 | 102.62 | 8.14 | 7.74 | 6.5 | 6.44 | 5.01 |
| 1996 | 142 | 131.81 | 127.24 | 125.58 | 123.96 | 7.37 | 6.97 | 5.96 | 5.63 | 4.35 |
| 1995 | 135.99 | 125.43 | 121.01 | 119.01 | 117.38 | 7.56 | 7.56 | 6.49 | 6.17 | 4.94 |
| 1994 | 125.48 | 115.78 | 111.06 | 109.35 | 107.65 | 6.6 | 7.48 | 6.49 | 6.13 | 4.88 |
| 1993 | 131.54 | 121.91 | 116.82 | 114.79 | 113.34 | 6.76 | 7.58 | 6.55 | 6.19 | 5 |
| 1992 | 123.23 | 113.86 | 108.26 | 106.54 | 104.64 | 6.38 | 7.47 | 6.49 | 6.18 | 4.88 |
| 1991 | 123.7 | 114.36 | 109.02 | 107.46 | 105.62 | 6.46 | 7.51 | 6.42 | 6.22 | 4.98 |
| 1990 | 122.77 | 113.69 | 108.35 | 106.99 | 104.9 | 6.06 | 7.23 | 6.26 | 5.91 | 4.58 |
| 1989 | 123.72 | 114.88 | 109.38 | 107.92 | 105.65 | 5.77 | 6.97 | 6.09 | 5.72 | 4.43 |
| 1988 | 121.96 | 112.59 | 107.19 | 105.6 | 103.46 | 6.14 | 7.41 | 6.23 | 6.05 | 4.73 |
| 1987 | 133.65 | 124.26 | 118.3 | 117 | 114.79 | 6.11 | 7.31 | 6.18 | 6.12 | 4.81 |
| 1986 | 120.95 | 111.5 | 105.57 | 104.44 | 102.01 | 6.16 | 7.45 | 6.3 | 6.17 | 4.89 |
| 1985 | 122.99 | 113.6 | 107.38 | 106.35 | 103.8 | 5.98 | 7.42 | 6.24 | 6 | 4.69 |
| 1984 | 133.03 | 124.25 | 118.12 | 117.13 | 114.61 | 5.42 | 7.01 | 6 | 5.49 | 4.16 |
| 1983 | 137.94 | 129.06 | 122.34 | 121.61 | 119.02 | 5.67 | 7.26 | 6.32 | 5.73 | 4.46 |
| 1982 | 129.43 | 120.39 | 112.96 | 112.72 | 110.29 | 5.69 | 7.15 | 5.91 | 5.68 | 4.44 |
| 1981 | 125.54 | 117.01 | 108.94 | 108.77 | 106.01 | 5.36 | 6.87 | 5.79 | 5.35 | 4.16 |
| 1980 | 137.87 | 129.44 | 121.61 | 121.45 | 118.85 | 5.28 | 6.85 | 5.78 | 5.26 | 4.08 |
| 1979 | 137.93 | 129.09 | 120.86 | 120.84 | 117.91 | 5.38 | 7.04 | 5.85 | 5.33 | 4.14 |
| 1978 | 151.85 | 142.48 | 134.29 | 134.78 | 131.6 | 5.78 | 7.47 | 6.3 | 5.81 | 4.6 |
| 1977 | 143.1 | 134 | 126.33 | 126.52 | 123.35 | 5.37 | 6.97 | 5.96 | 5.43 | 4.17 |
| 1976 | 133.32 | 123.43 | 115.65 | 115.79 | 112.55 | 5.77 | 7.44 | 6.37 | 5.79 | 4.55 |
| 1975 | 141.31 | 131.5 | 123.76 | 124.44 | 120.91 | 5.45 | 7.02 | 5.9 | 5.44 | 4.26 |
| 1974 | 137.26 | 128 | 120.37 | 121.03 | 117.99 | 5.03 | 6.45 | 5.39 | 5.01 | 3.86 |
| 1973 | 152.86 | 144.01 | 136.32 | 137.44 | 134.01 | 4.3 | 5.7 | 4.72 | 4.27 | 3.16 |
| 1972 | 121.46 | 112.43 | 104.67 | 106.11 | 102.03 | 4.16 | 5.56 | 4.58 | 4.08 | 2.99 |
| 1971 | 127.25 | 117.99 | 109.4 | 111.22 | 107.04 | 4.37 | 5.9 | 4.92 | 4.3 | 3.22 |
| 1970 | 136.5 | 127.02 | 117.58 | 120.28 | 115.34 | 4.58 | 6.09 | 5.12 | 4.49 | 3.39 |
| 1969 | 126.16 | 117.41 | 107.12 | 110.23 | 105.01 | 3.78 | 5.17 | 4.22 | 3.6 | 2.54 |
| 1968 | 118.09 | 109.77 | 99.37 | 103 | 97.1 | 3.62 | 4.97 | 4.06 | 3.47 | 2.43 |
| 1967 | 118.61 | 110.12 | 99.99 | 103.91 | 97.98 | 3.57 | 4.86 | 3.98 | 3.41 | 2.4 |
| 1966 | 119.68 | 111.93 | 100.41 | 105.99 | 98.22 | 3.23 | 4.24 | 3.35 | 3.07 | 2.12 |
| 1965 | 108.37 | 100.86 | 88.91 | 94.6 | 86.45 | 3.18 | 4.15 | 3.29 | 3 | 2.08 |
| 1964 | 93.37 | 85.96 | 73.35 | 78.58 | 69.87 | 3.24 | 4.24 | 3.33 | 3.05 | 2.1 |
| 1963 | 98 | 90.4 | 79.48 | 84.03 | 75.78 | 3.42 | 4.33 | 3.48 | 3.25 | 2.26 |
| 1962 | 105.29 | 97.63 | 86.32 | 90.7 | 83.11 | 3.57 | 4.38 | 3.6 | 3.41 | 2.39 |
| 1961 | 98.19 | 91.07 | 78.98 | 84.83 | 77.29 | 3.28 | 4 | 3.28 | 3.12 | 2.13 |


Comments