
Abstract
The latest data on exports of yam, an agricultural crop, shows that Ghana recorded the highest export volume of 45kt in 2021. This is an important indicator in global agriculture, suggesting that Ghana plays a major role in yam production and export. This trend is likely due to Ghana’s geographical conditions and agricultural policies, as well as growing demand within the region. In addition, since yams are consumed as a major food source in some regions, increases or decreases in export volumes may also affect regional food security. In addition, factors that will affect future export volumes, such as trends in other major producing countries and the impact of climate change, must also be taken into account.
Yam export volume (worldwide)
Looking at the long-term trend in yam exports, considering data from 1962 to 2021, Ghana recorded the highest volume in 2020 at 49kt. However, current exports are down to 91.8% of that peak. This fluctuation is likely due to many factors, including changes in agricultural policies, climate change, and fluctuations in market demand. Competition from other producing countries and the introduction of new agricultural technologies also play a role. While it is clear that Ghana plays a leading role in yam exports, changes in this trend could have implications for regional and global food supplies. Looking ahead, strategies to adopt sustainable agricultural practices and respond to market changes will be important.
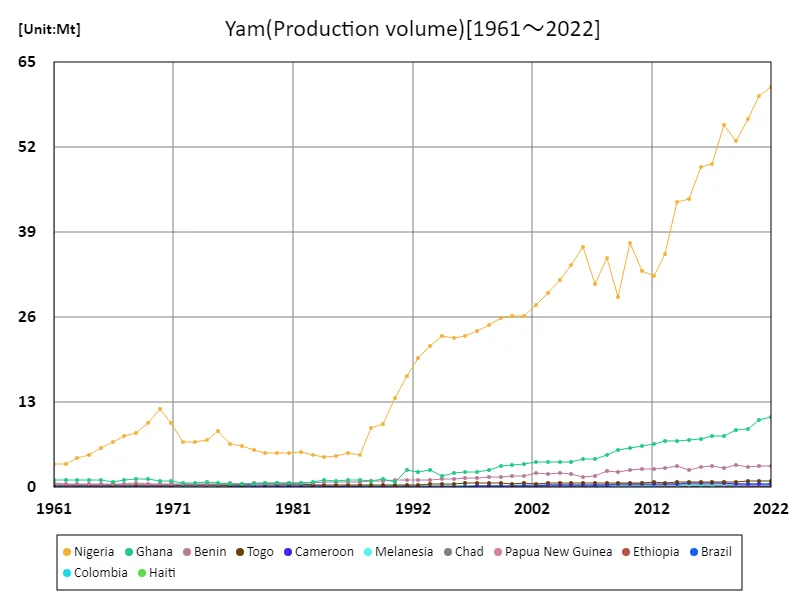
The maximum is the latest one, 61.2Mt of Nigeria
Yam export volume (latest year, countries around the world)
From the 2021 data on yam exports, Ghana recorded the highest overall at 45kt, with an average of 2.31kt for a total of 173kt. Considering the trends to date, yam exports have been relatively stable, with Ghana standing out among producing countries. Ghana has been a major producer of yams for many years, and its geographical conditions, agricultural techniques, and improved market access have contributed to the increase in export volume. In addition, yams are consumed as a major food source in some regions, so fluctuations in demand are also one of the factors that affect export volume. In recent years, the spread of sustainable agricultural practices and improved farmers’ techniques may have contributed to the increase in production and export volumes. However, factors such as climate change and market changes will continue to affect yam exports. Against this background, it is important for yam producing countries to respond flexibly to future demand and market changes and build sustainable agricultural systems.
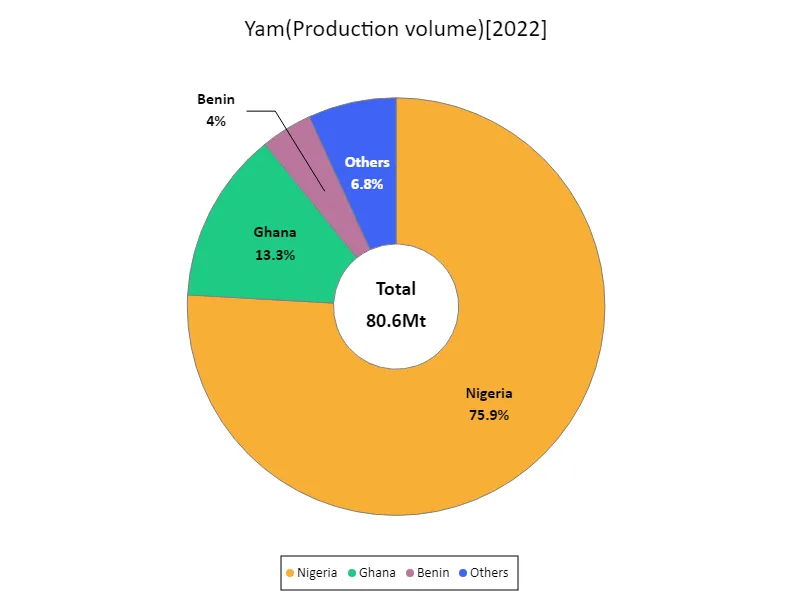
The maximum is 61.2Mt of Nigeria, the average is 1.39Mt, and the total is 80.6Mt
Yam export volume (continent)
According to 2021 yam export data, Africa recorded the highest overall, setting a record of 77kt. This shows that the African continent is the leading region in yam production and export. Looking at the characteristics so far, many African countries treat yams as an important food source, and the demand is one of the factors that raise the export volume. It is also possible that Africa’s regional climatic conditions, soil, and traditional agricultural practices are suitable for yam cultivation. In addition, the spread of sustainable agricultural practices and improvement of farmers’ techniques in recent years may have contributed to the increase in production and export volumes. Africa’s leading position in yam exports indicates that it plays an important role in the region’s agricultural economy. In the future, for sustainable production and exports, it will be necessary to improve agricultural infrastructure, expand market access, and implement climate change adaptation measures.
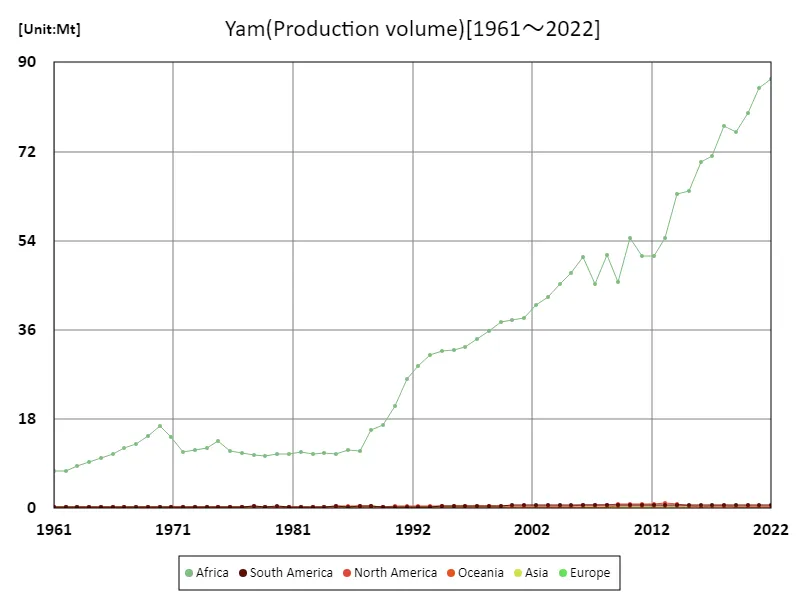
The maximum is the latest one, 86.6Mt of Africa
Yam export volume (latest year, continental)
According to yam export data for 2021, Africa recorded the highest overall export volume, setting a record of 64kt. This shows that the African continent is the leading region in yam production and export. Africa has been a major producer of yams for many years, and its geographical conditions and agricultural technology have contributed to the increase in export volume. In particular, in the West African region, yams are cultivated and exported as an important food source. On the other hand, yams are also produced and exported in regions other than Africa, and there are fluctuations in demand and production volume from region to region. In addition, yams are consumed as a major food source in some regions, so fluctuations in demand also affect the export volume. In recent years, the spread of sustainable agricultural practices and improvements in farmers’ techniques may have contributed to the increase in production and export volumes. However, factors such as climate change and market changes will continue to affect yam exports. Against this background, it is important for yam-producing countries to respond flexibly to future changes in demand and markets and build sustainable agricultural systems.
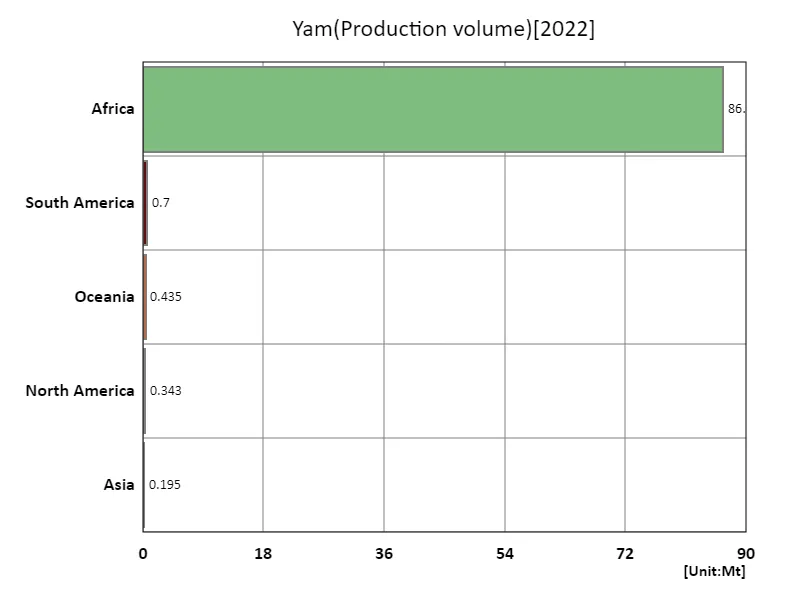
The maximum is 86.6Mt of Africa, the average is 17.7Mt, and the total is 88.3Mt
Main data
| Production(Yam, Production volume, t) [Mt] | ||||||||||
|---|---|---|---|---|---|---|---|---|---|---|
| World | Africa | Western Africa | Lower-middle-income countries | Nigeria | Net Food Importing Developing Countries | Ghana | Cote d’Ivoire | Low Income Food Deficit Countries | Least Developed Countries | |
| 2022 | 88.26 | 86.58 | 84.36 | 84.25 | 61.17 | 14.53 | 10.72 | 7.6 | 6.9 | 6.37 |
| 2021 | 86.4 | 84.72 | 82.52 | 82.44 | 59.88 | 14.42 | 10.28 | 7.59 | 6.79 | 6.29 |
| 2020 | 81.49 | 79.81 | 77.61 | 77.55 | 56.35 | 14.37 | 8.95 | 7.65 | 6.69 | 6.19 |
| 2019 | 77.65 | 75.99 | 73.8 | 73.86 | 52.91 | 14.18 | 8.75 | 7.45 | 6.71 | 6.21 |
| 2018 | 78.77 | 77.11 | 74.83 | 74.98 | 55.36 | 13.73 | 7.86 | 7.39 | 6.33 | 5.76 |
| 2017 | 72.83 | 71.18 | 68.9 | 69.09 | 49.52 | 13.62 | 7.86 | 7.15 | 6.48 | 5.9 |
| 2016 | 71.48 | 69.84 | 67.56 | 67.73 | 48.98 | 13.19 | 7.44 | 6.9 | 6.35 | 5.75 |
| 2015 | 65.87 | 64.06 | 61.77 | 62.21 | 44.1 | 12.65 | 7.3 | 6.65 | 6.05 | 5.46 |
| 2014 | 65.48 | 63.5 | 61.32 | 61.93 | 43.71 | 12.91 | 7.12 | 6.2 | 6.74 | 6.17 |
| 2013 | 56.8 | 54.52 | 52.37 | 52.98 | 35.62 | 12.34 | 7.07 | 5.73 | 6.31 | 5.77 |
| 2012 | 53.14 | 50.98 | 48.65 | 48.88 | 32.32 | 12.45 | 6.64 | 5.67 | 6.45 | 5.93 |
| 2011 | 53.13 | 50.9 | 48.71 | 49.07 | 33.13 | 11.93 | 6.3 | 5.53 | 6.07 | 5.56 |
| 2010 | 56.74 | 54.47 | 52.33 | 52.69 | 37.33 | 11.72 | 5.96 | 5.39 | 5.94 | 5.45 |
| 2009 | 47.74 | 45.61 | 43.52 | 43.84 | 29.09 | 11.19 | 5.78 | 5.31 | 5.53 | 5.08 |
| 2008 | 52.87 | 51.02 | 49.2 | 49.47 | 35.02 | 11.45 | 4.89 | 5.95 | 5.22 | 4.83 |
| 2007 | 47.16 | 45.31 | 43.47 | 43.76 | 31.14 | 10.15 | 4.38 | 5.5 | 4.35 | 3.98 |
| 2006 | 52.35 | 50.61 | 48.92 | 49.17 | 36.72 | 9.85 | 4.29 | 5.57 | 4.09 | 3.73 |
| 2005 | 49.15 | 47.44 | 45.87 | 46.15 | 34 | 9.77 | 3.92 | 5.16 | 4.41 | 4.08 |
| 2004 | 46.95 | 45.23 | 43.71 | 43.81 | 31.78 | 9.87 | 3.89 | 5 | 4.59 | 4.32 |
| 2003 | 44.27 | 42.6 | 41.09 | 41.24 | 29.7 | 9.38 | 3.81 | 4.84 | 4.28 | 4.01 |
| 2002 | 42.59 | 40.98 | 39.38 | 39.55 | 27.91 | 9.44 | 3.9 | 4.71 | 4.48 | 4.22 |
| 2001 | 40.08 | 38.48 | 36.89 | 36.96 | 26.23 | 9 | 3.55 | 4.58 | 4.16 | 3.9 |
| 2000 | 39.64 | 38.09 | 36.51 | 36.65 | 26.2 | 8.78 | 3.36 | 4.46 | 4.11 | 3.86 |
| 1999 | 39.01 | 37.51 | 35.98 | 35.97 | 25.87 | 8.65 | 3.25 | 4.34 | 4.11 | 3.85 |
| 1998 | 37.1 | 35.69 | 34.14 | 34.12 | 24.77 | 8.48 | 2.7 | 4.22 | 4.05 | 3.81 |
| 1997 | 35.55 | 34.15 | 32.74 | 32.69 | 23.97 | 8.18 | 2.41 | 4.11 | 3.77 | 3.62 |
| 1996 | 34.14 | 32.64 | 31.31 | 31.26 | 23.2 | 7.64 | 2.27 | 3.71 | 3.55 | 3.44 |
| 1995 | 33.27 | 31.87 | 30.57 | 30.58 | 22.82 | 7.36 | 2.13 | 3.62 | 3.4 | 3.27 |
| 1994 | 33.15 | 31.75 | 30.3 | 30.38 | 23.15 | 7.32 | 1.7 | 3.53 | 3.46 | 3.33 |
| 1993 | 32.29 | 31.02 | 29.66 | 29.67 | 21.63 | 7.07 | 2.72 | 3.44 | 3.32 | 3.21 |
| 1992 | 30 | 28.7 | 27.24 | 27.47 | 19.78 | 6.98 | 2.33 | 3.52 | 3.16 | 3.04 |
| 1991 | 27.23 | 26 | 24.57 | 24.74 | 16.96 | 6.75 | 2.63 | 3.26 | 3.23 | 3.11 |
| 1990 | 21.78 | 20.6 | 19.26 | 19.36 | 13.62 | 6.43 | 0.88 | 3.18 | 2.98 | 2.89 |
| 1989 | 17.93 | 16.75 | 15.53 | 15.54 | 9.61 | 6.21 | 1.26 | 3.09 | 2.85 | 2.8 |
| 1988 | 16.97 | 15.78 | 14.52 | 14.53 | 9.13 | 6.06 | 0.9 | 3 | 2.78 | 2.71 |
| 1987 | 12.81 | 11.59 | 10.36 | 10.4 | 4.89 | 5.8 | 1.19 | 2.91 | 2.64 | 2.54 |
| 1986 | 12.96 | 11.85 | 10.59 | 10.56 | 5.21 | 5.84 | 1.05 | 2.82 | 2.8 | 2.68 |
| 1985 | 12.11 | 10.92 | 9.66 | 9.67 | 4.74 | 5.49 | 0.99 | 2.65 | 2.59 | 2.51 |
| 1984 | 12.38 | 11.24 | 9.99 | 10.04 | 4.6 | 5.69 | 1.18 | 2.87 | 2.62 | 2.49 |
| 1983 | 11.98 | 10.9 | 9.6 | 9.64 | 5 | 5.22 | 0.87 | 2.56 | 2.51 | 2.36 |
| 1982 | 12.3 | 11.28 | 9.96 | 9.95 | 5.39 | 5.42 | 0.59 | 2.68 | 2.66 | 2.46 |
| 1981 | 12.02 | 10.95 | 9.66 | 9.59 | 5.21 | 5.28 | 0.59 | 2.49 | 2.68 | 2.48 |
| 1980 | 12 | 10.89 | 9.64 | 9.61 | 5.25 | 5.15 | 0.65 | 2.41 | 2.61 | 2.42 |
| 1979 | 11.6 | 10.47 | 9.28 | 9.26 | 5.26 | 4.79 | 0.6 | 2.07 | 2.58 | 2.39 |
| 1978 | 11.97 | 10.79 | 9.61 | 9.59 | 5.78 | 4.65 | 0.54 | 1.98 | 2.53 | 2.33 |
| 1977 | 12.21 | 11.12 | 9.91 | 10.01 | 6.38 | 4.34 | 0.54 | 1.89 | 2.36 | 2.14 |
| 1976 | 12.55 | 11.54 | 10.31 | 10.41 | 6.56 | 4.51 | 0.58 | 2.03 | 2.43 | 2.18 |
| 1975 | 14.59 | 13.6 | 12.39 | 12.54 | 8.62 | 4.33 | 0.71 | 2.08 | 2.25 | 1.95 |
| 1974 | 13.18 | 12.21 | 10.96 | 11.18 | 7.16 | 4.19 | 0.85 | 2 | 2.26 | 1.9 |
| 1973 | 12.67 | 11.71 | 10.44 | 10.69 | 6.94 | 4.04 | 0.69 | 1.8 | 2.34 | 1.95 |
| 1972 | 12.35 | 11.39 | 10.15 | 10.38 | 6.9 | 3.8 | 0.68 | 1.53 | 2.34 | 1.97 |
| 1971 | 15.28 | 14.35 | 13.18 | 13.43 | 9.77 | 3.72 | 0.91 | 1.56 | 2.17 | 1.87 |
| 1970 | 17.43 | 16.53 | 15.41 | 15.63 | 12.03 | 3.63 | 0.91 | 1.55 | 2.09 | 1.83 |
| 1969 | 15.51 | 14.63 | 13.57 | 13.71 | 9.79 | 3.6 | 1.33 | 1.52 | 2.05 | 1.85 |
| 1968 | 13.87 | 12.98 | 11.91 | 12.07 | 8.23 | 3.58 | 1.24 | 1.39 | 2.17 | 1.96 |
| 1967 | 13.13 | 12.27 | 11.25 | 11.41 | 7.81 | 3.42 | 1.13 | 1.35 | 2.03 | 1.83 |
| 1966 | 11.87 | 11.01 | 10.02 | 10.17 | 6.99 | 3.24 | 0.87 | 1.32 | 1.89 | 1.7 |
| 1965 | 11.04 | 10.22 | 9.29 | 9.41 | 6 | 3.26 | 1.06 | 1.3 | 1.91 | 1.74 |
| 1964 | 10.07 | 9.25 | 8.34 | 8.47 | 5 | 3.2 | 1.15 | 1.26 | 1.89 | 1.72 |
| 1963 | 9.4 | 8.61 | 7.7 | 7.82 | 4.5 | 3.1 | 1.1 | 1.23 | 1.82 | 1.65 |
| 1962 | 8.31 | 7.55 | 6.68 | 6.79 | 3.5 | 3.03 | 1.1 | 1.2 | 1.78 | 1.61 |
| 1961 | 8.32 | 7.59 | 6.76 | 6.85 | 3.5 | 3.06 | 1.1 | 1.15 | 1.87 | 1.7 |


Comments