Abstract
China has an overwhelming presence in garlic production in global agriculture. China’s production in 2022 was 21.4 Mt, which is far more than that of other countries. China’s garlic production has been stable for many years, mainly due to climatic conditions and advances in agricultural technology. Countries other than China are also engaged in garlic production, especially India, South Korea, Egypt, and Russia, but the production volume of these countries tends to be significantly lower than that of China. On the other hand, the demand for garlic is stable worldwide and is diverse, including for cooking and medical purposes. While China’s production is stable, there are fluctuations in production in some years due to factors such as weather and disease. Thus, while China is the main producer of garlic, other countries also produce garlic based on their own characteristics and conditions.
Garlic production (worldwide)
China has been the leading producer of garlic for many years. Looking at data from 1961 to 2022, China’s production has grown steadily, reaching an all-time high of 21.8 Mt in 2015. However, it has now fallen to 98.3% of its peak. This decline is due to factors such as changes in agricultural practices, changes in land use due to economic growth, and climate change. Meanwhile, other countries are also working on garlic production, notably India, South Korea, Egypt, and Russia. Although these countries have the second-largest production capacity after China, they have not yet caught up with China’s production. Garlic is an important agricultural product around the world and its demand is stable. It is used for various purposes, including cooking and medical purposes. In the future, the garlic market is expected to see a resurgence in Chinese production and competition from the expansion of production in other countries.
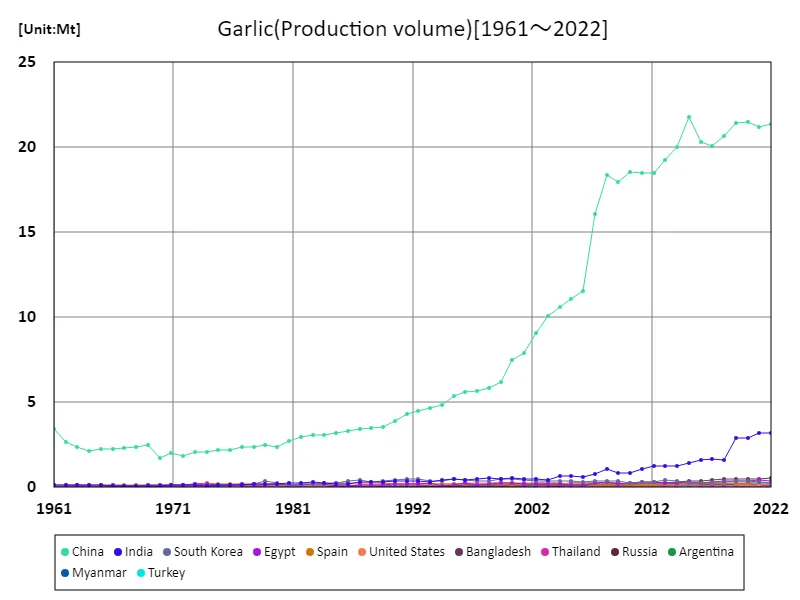
The maximum is 21.8Mt[2015] of China, and the current value is about 98.3%
Garlic production (latest year, world)
China has an overwhelming presence in the production of garlic in global agriculture. According to data for 2022, China’s production reached a maximum of 21.4 Mt overall, with an average of 280 kt, and a total production of 29.1 Mt. China has been a major producer of garlic for many years, and its stable production is due to climatic conditions and the development of agricultural technology. Meanwhile, other countries are also working on garlic production, including India, South Korea, Egypt, and Russia. Although the production volumes of these countries are lower than those of China, they still contribute to the overall supply of the world. Garlic has a stable demand worldwide and is widely used for cooking, medical purposes, and other purposes. While China’s production volume is stable, there are fluctuations in production volume in some years due to factors such as climate change and disease. In the future garlic market, attention will be focused on the trends in Chinese production volume and the expansion of production in other countries.
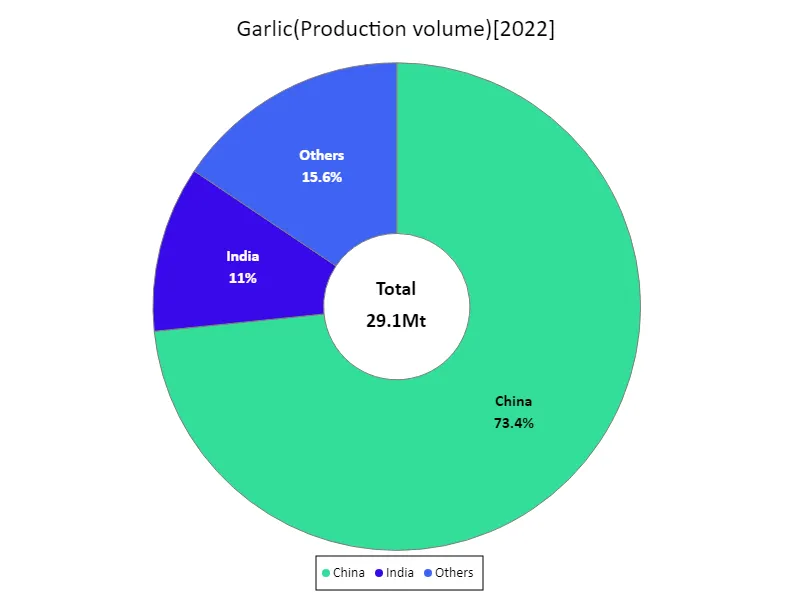
The maximum is 21.4Mt of China, the average is 280kt, and the total is 29.1Mt
Garlic production (continent)
Asia was the largest producer of garlic in 2022, reaching an all-time high. Garlic production in Asia far exceeds that of other regions, and the main factor is the active production of several countries, including China. China is a major producer of garlic in particular, and its production capacity meets global demand. Other Asian countries are also focusing on garlic production, including India, Korea, and Thailand. These countries grow garlic in environments suitable for the regional climatic conditions and agricultural practices, supporting the overall production volume of Asia. On the other hand, garlic is also produced in other regions, but Asia has an overwhelming presence. Garlic is widely used around the world and has a wide range of uses, including flavoring food and health benefits. Its demand is stable, and Asian production is meeting that demand. In the future, attention will be focused on the possibility of further increase in garlic production in Asia and competition with other regions.
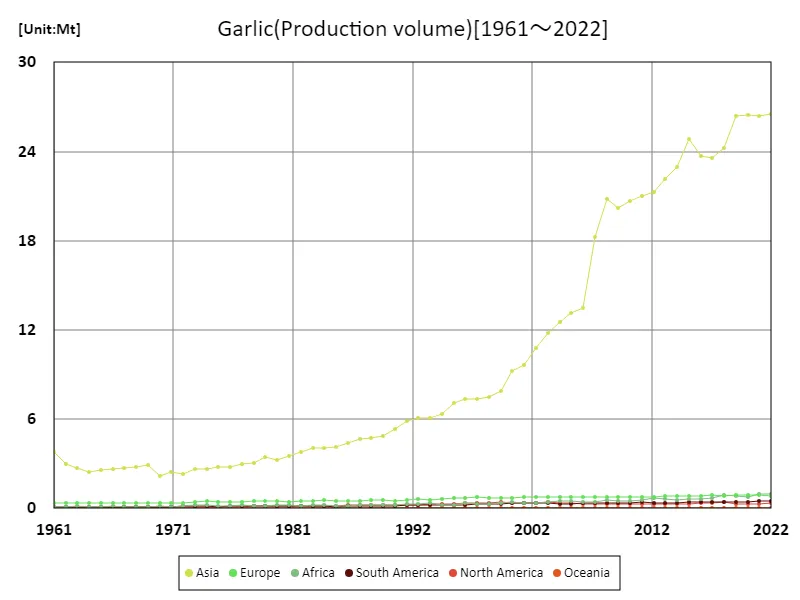
The maximum is the latest one, 26.6Mt of Asia
Garlic production (latest year, continent)
Asia recorded the largest overall production of the agricultural crop garlic in 2022, with the value reaching an all-time high. Garlic production in the Asian region far exceeds other regions, and the main factor is the active production of several countries, including China. China is a major producer of garlic, and its production capacity contributes significantly to global demand. Other Asian countries are also focusing on garlic production, with India, South Korea, and Thailand at the forefront. These countries cultivate garlic in environments suitable for the regional climatic conditions and agricultural practices, supporting the overall production volume of Asia. Meanwhile, garlic is also produced in other regions, but Asia has an overwhelming presence. Garlic is widely used worldwide and has a wide range of uses, including flavoring food and health benefits. Its demand is stable, and Asian production is meeting that demand. In the future, attention will be focused on the possibility of further increase in garlic production in Asia and competition with other regions.
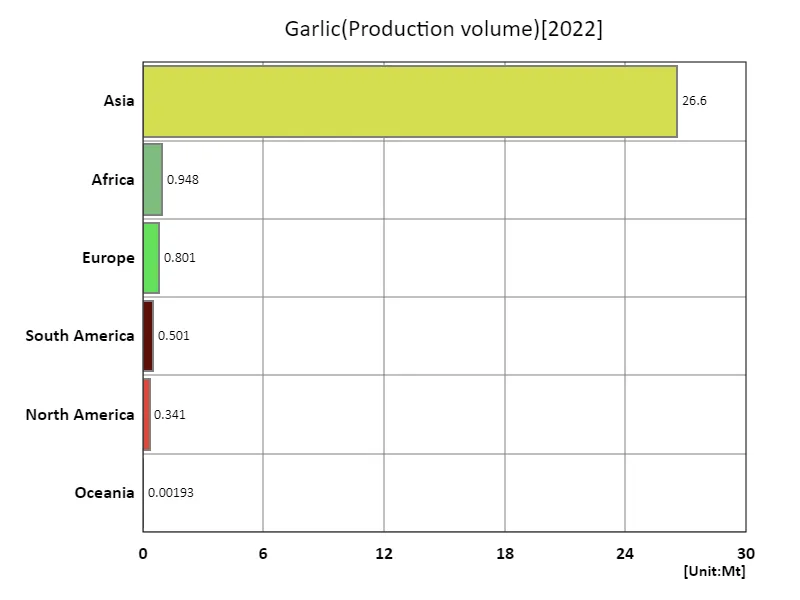
The maximum is 26.6Mt of Asia, the average is 4.86Mt, and the total is 29.1Mt
Main data
| Production(Garlic, Production volume, t) [Mt] | ||||||||||
|---|---|---|---|---|---|---|---|---|---|---|
| World | Asia | Upper-middle-income countries | Eastern Asia | China | Lower-middle-income countries | Southern Asia | India | Net Food Importing Developing Countries | Least Developed Countries | |
| 2022 | 29.15 | 26.56 | 22.41 | 21.76 | 21.39 | 5.34 | 3.98 | 3.21 | 1.8 | 1.11 |
| 2021 | 29.03 | 26.39 | 22.22 | 21.62 | 21.21 | 5.36 | 3.95 | 3.19 | 1.81 | 1.06 |
| 2020 | 28.89 | 26.48 | 22.56 | 21.97 | 21.51 | 4.99 | 3.63 | 2.93 | 1.59 | 0.96 |
| 2019 | 28.86 | 26.4 | 22.49 | 21.93 | 21.45 | 4.97 | 3.58 | 2.91 | 1.57 | 0.98 |
| 2018 | 26.8 | 24.25 | 21.7 | 21.11 | 20.68 | 3.62 | 2.27 | 1.61 | 1.61 | 1 |
| 2017 | 25.91 | 23.55 | 21.07 | 20.5 | 20.1 | 3.46 | 2.31 | 1.69 | 1.45 | 0.91 |
| 2016 | 25.86 | 23.69 | 21.39 | 20.7 | 20.33 | 3.27 | 2.18 | 1.62 | 1.35 | 0.85 |
| 2015 | 26.97 | 24.83 | 22.81 | 22.13 | 21.77 | 3 | 1.95 | 1.43 | 1.32 | 0.79 |
| 2014 | 25.02 | 22.97 | 21.05 | 20.5 | 20.05 | 2.73 | 1.73 | 1.25 | 1.23 | 0.74 |
| 2013 | 24.25 | 22.18 | 20.23 | 19.74 | 19.23 | 2.67 | 1.64 | 1.26 | 1.17 | 0.72 |
| 2012 | 23.41 | 21.27 | 19.5 | 18.93 | 18.49 | 2.6 | 1.6 | 1.23 | 1.27 | 0.76 |
| 2011 | 23.09 | 21.01 | 19.54 | 18.9 | 18.51 | 2.37 | 1.41 | 1.06 | 1.17 | 0.64 |
| 2010 | 22.58 | 20.68 | 19.5 | 18.92 | 18.55 | 1.96 | 1.15 | 0.83 | 1.04 | 0.59 |
| 2009 | 22.08 | 20.18 | 18.92 | 18.43 | 17.97 | 1.88 | 1.15 | 0.83 | 1.01 | 0.61 |
| 2008 | 22.79 | 20.83 | 19.33 | 18.84 | 18.36 | 2.2 | 1.36 | 1.07 | 1.07 | 0.52 |
| 2007 | 20.12 | 18.28 | 17.1 | 16.53 | 16.06 | 1.85 | 1.11 | 0.78 | 0.99 | 0.53 |
| 2006 | 15.33 | 13.48 | 12.56 | 12.01 | 11.57 | 1.5 | 0.86 | 0.6 | 0.84 | 0.47 |
| 2005 | 15.06 | 13.15 | 12.09 | 11.57 | 11.08 | 1.55 | 0.91 | 0.65 | 0.89 | 0.52 |
| 2004 | 14.46 | 12.55 | 11.52 | 11.06 | 10.59 | 1.56 | 0.91 | 0.69 | 0.83 | 0.44 |
| 2003 | 13.68 | 11.79 | 11.06 | 10.56 | 10.08 | 1.23 | 0.63 | 0.46 | 0.71 | 0.31 |
| 2002 | 12.57 | 10.75 | 9.97 | 9.56 | 9.08 | 1.23 | 0.66 | 0.5 | 0.65 | 0.28 |
| 2001 | 11.46 | 9.61 | 8.8 | 8.39 | 7.89 | 1.27 | 0.68 | 0.5 | 0.67 | 0.25 |
| 2000 | 11.08 | 9.26 | 8.35 | 8.04 | 7.49 | 1.33 | 0.7 | 0.52 | 0.7 | 0.22 |
| 1999 | 9.69 | 7.91 | 7 | 6.75 | 6.19 | 1.19 | 0.66 | 0.5 | 0.59 | 0.19 |
| 1998 | 9.12 | 7.52 | 6.63 | 6.29 | 5.81 | 1.21 | 0.75 | 0.57 | 0.5 | 0.17 |
| 1997 | 8.93 | 7.33 | 6.51 | 6.16 | 5.69 | 1.09 | 0.66 | 0.48 | 0.48 | 0.16 |
| 1996 | 8.96 | 7.34 | 6.38 | 6.15 | 5.61 | 1.14 | 0.59 | 0.44 | 0.57 | 0.14 |
| 1995 | 8.45 | 7.09 | 6.1 | 5.91 | 5.37 | 1.03 | 0.61 | 0.48 | 0.41 | 0.13 |
| 1994 | 7.68 | 6.36 | 5.52 | 5.32 | 4.87 | 0.92 | 0.53 | 0.4 | 0.38 | 0.13 |
| 1993 | 7.49 | 6.1 | 5.28 | 5.16 | 4.68 | 0.98 | 0.46 | 0.31 | 0.49 | 0.12 |
| 1992 | 7.42 | 6.06 | 5.16 | 5.03 | 4.48 | 0.96 | 0.53 | 0.36 | 0.43 | 0.12 |
| 1991 | 7.13 | 5.85 | 4.99 | 4.88 | 4.31 | 0.87 | 0.52 | 0.37 | 0.44 | 0.11 |
| 1990 | 6.46 | 5.32 | 4.51 | 4.42 | 3.92 | 0.78 | 0.47 | 0.35 | 0.38 | 0.1 |
| 1989 | 6 | 4.87 | 4.16 | 4.01 | 3.58 | 0.69 | 0.43 | 0.33 | 0.35 | 0.11 |
| 1988 | 5.82 | 4.7 | 4.07 | 3.85 | 3.48 | 0.67 | 0.41 | 0.31 | 0.36 | 0.1 |
| 1987 | 5.78 | 4.68 | 3.96 | 3.87 | 3.4 | 0.66 | 0.41 | 0.32 | 0.36 | 0.1 |
| 1986 | 5.37 | 4.4 | 3.8 | 3.73 | 3.3 | 0.47 | 0.3 | 0.21 | 0.28 | 0.1 |
| 1985 | 5.09 | 4.14 | 3.66 | 3.5 | 3.19 | 0.46 | 0.28 | 0.19 | 0.27 | 0.1 |
| 1984 | 5.18 | 4.08 | 3.61 | 3.35 | 3.1 | 0.62 | 0.36 | 0.27 | 0.37 | 0.1 |
| 1983 | 5.09 | 4.04 | 3.53 | 3.33 | 3.06 | 0.65 | 0.4 | 0.31 | 0.36 | 0.09 |
| 1982 | 4.76 | 3.81 | 3.39 | 3.17 | 2.95 | 0.55 | 0.33 | 0.25 | 0.31 | 0.09 |
| 1981 | 4.43 | 3.54 | 3.17 | 2.93 | 2.74 | 0.53 | 0.31 | 0.23 | 0.3 | 0.08 |
| 1980 | 4.25 | 3.24 | 2.8 | 2.66 | 2.38 | 0.55 | 0.29 | 0.22 | 0.34 | 0.08 |
| 1979 | 4.41 | 3.45 | 2.91 | 2.88 | 2.5 | 0.5 | 0.28 | 0.21 | 0.3 | 0.08 |
| 1978 | 4 | 3.07 | 2.78 | 2.59 | 2.4 | 0.45 | 0.24 | 0.17 | 0.28 | 0.07 |
| 1977 | 3.85 | 2.96 | 2.69 | 2.53 | 2.34 | 0.45 | 0.19 | 0.13 | 0.31 | 0.07 |
| 1976 | 3.54 | 2.77 | 2.55 | 2.34 | 2.21 | 0.38 | 0.18 | 0.13 | 0.25 | 0.06 |
| 1975 | 3.55 | 2.76 | 2.53 | 2.32 | 2.19 | 0.39 | 0.21 | 0.14 | 0.25 | 0.07 |
| 1974 | 3.54 | 2.64 | 2.5 | 2.21 | 2.09 | 0.38 | 0.15 | 0.08 | 0.3 | 0.07 |
| 1973 | 3.47 | 2.63 | 2.47 | 2.18 | 2.07 | 0.44 | 0.19 | 0.12 | 0.32 | 0.07 |
| 1972 | 2.98 | 2.28 | 2.12 | 1.92 | 1.82 | 0.34 | 0.18 | 0.11 | 0.23 | 0.07 |
| 1971 | 3.15 | 2.47 | 2.34 | 2.1 | 2 | 0.33 | 0.18 | 0.11 | 0.22 | 0.07 |
| 1970 | 2.85 | 2.14 | 2.02 | 1.81 | 1.71 | 0.36 | 0.17 | 0.1 | 0.26 | 0.08 |
| 1969 | 3.59 | 2.92 | 2.78 | 2.59 | 2.5 | 0.32 | 0.18 | 0.1 | 0.23 | 0.07 |
| 1968 | 3.4 | 2.8 | 2.66 | 2.48 | 2.39 | 0.29 | 0.18 | 0.1 | 0.19 | 0.07 |
| 1967 | 3.29 | 2.7 | 2.58 | 2.37 | 2.28 | 0.29 | 0.17 | 0.1 | 0.19 | 0.07 |
| 1966 | 3.26 | 2.63 | 2.52 | 2.32 | 2.24 | 0.32 | 0.16 | 0.1 | 0.22 | 0.07 |
| 1965 | 3.17 | 2.57 | 2.47 | 2.3 | 2.25 | 0.27 | 0.16 | 0.11 | 0.16 | 0.05 |
| 1964 | 3.07 | 2.47 | 2.37 | 2.19 | 2.13 | 0.27 | 0.17 | 0.13 | 0.15 | 0.06 |
| 1963 | 3.36 | 2.74 | 2.61 | 2.43 | 2.38 | 0.35 | 0.19 | 0.14 | 0.22 | 0.06 |
| 1962 | 3.54 | 3 | 2.86 | 2.7 | 2.65 | 0.29 | 0.18 | 0.14 | 0.16 | 0.06 |
| 1961 | 4.3 | 3.77 | 3.65 | 3.5 | 3.46 | 0.26 | 0.17 | 0.13 | 0.14 | 0.05 |
Comments