Abstract
Data for 2022 reveals that India is the world’s largest producer of onions. This advantage is due to India’s vast agricultural land and diverse climatic conditions, as well as the fact that onions are consumed as an important food in the country. On the other hand, other major onion-producing countries include China and Egypt, which are also active producers, but not on the same scale as India. The demand for onions is stable worldwide, and they are widely used as a basic element in the food industry and cooking. Therefore, it is expected that India’s production will continue to hold a leading position, but factors such as climate change and changes in agricultural policies may cause fluctuations in the ranking of producing countries and production volumes.
Onion production (worldwide)
Onion production has increased globally over the past few decades. This growth is due to advances in agricultural technology, improved productivity, and rising demand. Agriculture, especially in developing countries, is modernizing, leading to improved onion cultivation techniques and varieties. India’s rapid economic growth has led to an expansion of the country’s agricultural sector, which has led to an increase in onion production. However, factors such as climate change and poor weather can affect production in some regions. Changes in demand and fluctuations in trade relations also affect the onion market. Going forward, it is expected that the adoption of sustainable agricultural practices and technological innovations will support onion production and contribute to global food security.
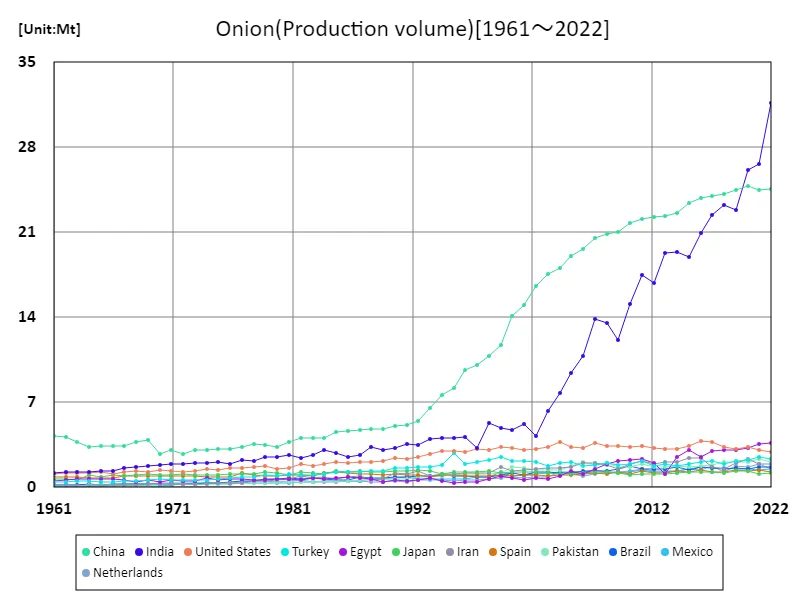
The maximum is the latest one, 31.7Mt of India
Onion production (latest year, world)
The production of onion as an agricultural crop is supported by stable global demand and rich agricultural regions. In particular, India’s overwhelming production of 31.7 Mt accounts for about one-third of the total global production. This figure reflects the fact that India has vast agricultural land and diverse climatic conditions, and onions are consumed as an important food in the country. Meanwhile, other major producing countries also contribute to onion production, reaching a total of 111 Mt. This shows that onions are in demand as an important food globally, and many countries are focusing on production. This trend is due to the increase in global food demand and the multipurpose use of onions. Advances in agricultural technology and the adoption of sustainable agricultural practices also contribute to the increase in production. However, factors such as climate change and unfavorable weather can cause fluctuations in production. It is expected that countries around the world will continue to focus on onion production and make efforts to meet the demand.
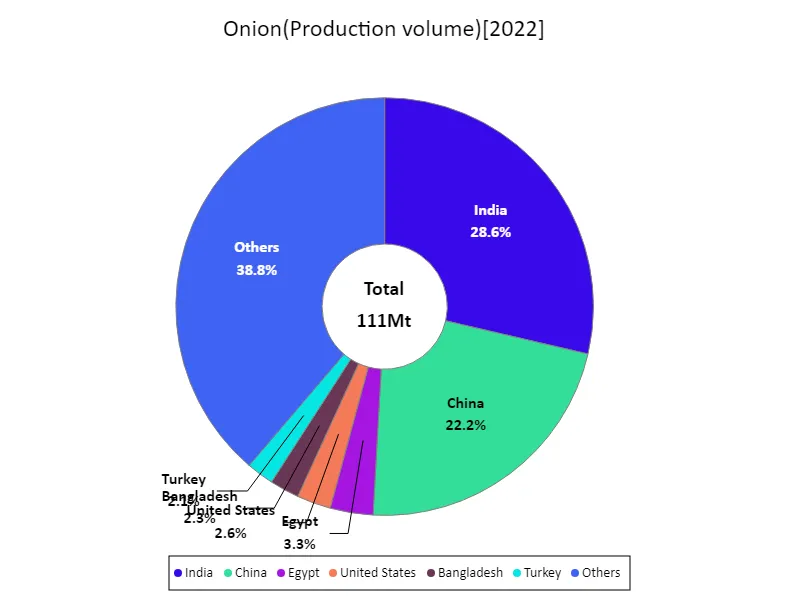
The maximum is 31.7Mt of India, the average is 774kt, and the total is 111Mt
Onion production (continent)
Asia’s production of agricultural onions reached a record 76.4 Mt in 2022, making it the largest producer in the world. Behind this increase is the rapid economic growth of Asian countries and the increase in food demand due to population growth. Large agricultural countries such as China and India in particular are focusing on onion production, leading the world’s production. Advances in agricultural technology, improved cultivation methods, and seed selection also contribute to increased production. On the other hand, there is a risk that climate change and weather instability will affect agricultural production. Therefore, the adoption of sustainable agricultural practices and the development of irrigation facilities will be important factors supporting future onion production. From the perspective of global food security, the agricultural sector must also focus on improving productivity and ensuring sustainability.
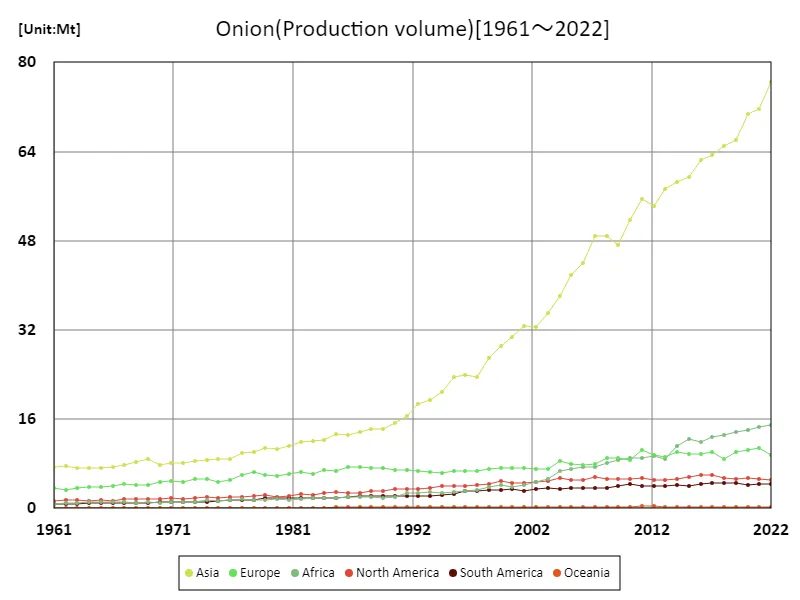
The maximum is the latest one, 76.4Mt of Asia
Onion production (latest year, continent)
Asia’s production of agricultural onions reached a record 76.4 Mt in 2022, making it the largest producer in the world. This increase is due to the rapid economic growth of Asian countries and the growing demand for food due to population growth. Large agricultural countries such as China and India in particular are focusing on onion production, leading the world’s production. On the other hand, onion production is also thriving in regions other than Asia, and many countries in Europe and North America are actively engaged in production. This brings the average global onion production to 18.4 Mt, and the total to 111 Mt. Advances in agricultural technology, improved cultivation methods, and seed selection have contributed to increased production, but there are still risks that climate change and weather instability will affect agricultural production. The adoption of sustainable agricultural practices and the development of irrigation facilities are essential to ensure future onion production. As a result, the global agricultural sector must continue to focus on improving productivity and ensuring sustainability and making efforts to ensure food security.
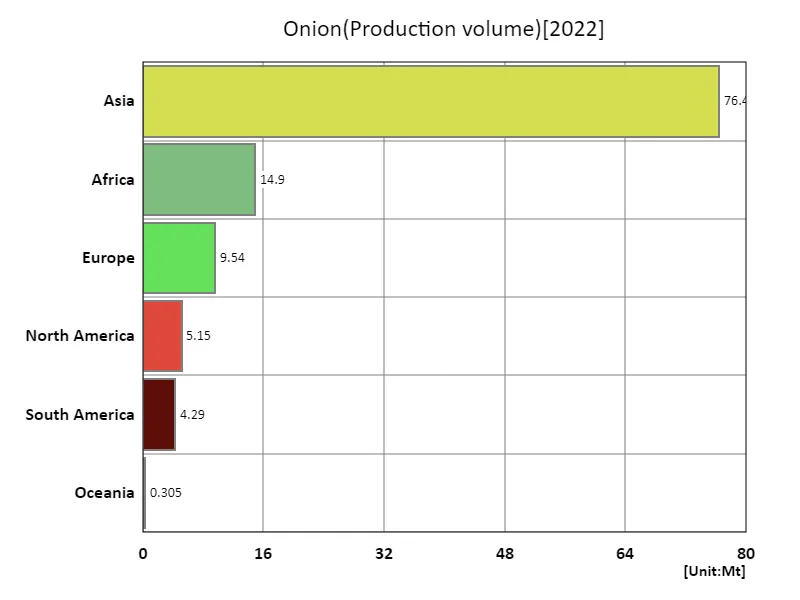
The maximum is 76.4Mt of Asia, the average is 18.4Mt, and the total is 111Mt
Main data
| Production(Onion, Production volume, t) [Mt] | ||||||||||
|---|---|---|---|---|---|---|---|---|---|---|
| World | Asia | Lower-middle-income countries | Upper-middle-income countries | Southern Asia | India | Eastern Asia | China | Net Food Importing Developing Countries | Africa | |
| 2022 | 110.62 | 76.43 | 52.54 | 39.16 | 38.77 | 31.69 | 27.12 | 24.61 | 17.57 | 14.9 |
| 2021 | 106.75 | 71.7 | 47.6 | 39.06 | 33.79 | 26.64 | 27.27 | 24.49 | 17.4 | 14.52 |
| 2020 | 105.11 | 70.66 | 46.62 | 39.08 | 32.97 | 26.09 | 27.44 | 24.82 | 16.36 | 14.08 |
| 2019 | 100.08 | 66.14 | 42.31 | 38.58 | 29.11 | 22.82 | 27.53 | 24.5 | 15.86 | 13.72 |
| 2018 | 97.41 | 65.04 | 42.12 | 37.79 | 28.89 | 23.26 | 26.95 | 24.18 | 15.32 | 13.22 |
| 2017 | 97.08 | 63.39 | 40.4 | 38.15 | 28.15 | 22.43 | 26.5 | 24.03 | 14.98 | 12.75 |
| 2016 | 94.84 | 62.45 | 39.13 | 37.4 | 27.07 | 20.93 | 26.43 | 23.79 | 14.03 | 11.93 |
| 2015 | 91.57 | 59.47 | 37.73 | 36.55 | 25.06 | 18.93 | 25.89 | 23.44 | 14.75 | 12.4 |
| 2014 | 89.45 | 58.56 | 36.67 | 35.51 | 24.96 | 19.4 | 25.45 | 22.59 | 13.54 | 11.18 |
| 2013 | 84.77 | 57.31 | 34.31 | 34.73 | 24.53 | 19.3 | 24.81 | 22.35 | 11.28 | 8.9 |
| 2012 | 82.56 | 54.18 | 32.28 | 34.56 | 22.01 | 16.81 | 24.63 | 22.24 | 11.84 | 9.3 |
| 2011 | 84.67 | 55.5 | 33.04 | 35.02 | 23.08 | 17.51 | 24.74 | 22.06 | 12.19 | 8.99 |
| 2010 | 79.14 | 51.63 | 29.77 | 33.88 | 20.05 | 15.12 | 24.29 | 21.75 | 11.43 | 9.08 |
| 2009 | 74.37 | 47.21 | 25.96 | 32.59 | 16.59 | 12.16 | 23.66 | 21.05 | 10.96 | 8.64 |
| 2008 | 75.01 | 48.84 | 27.51 | 32.41 | 18.79 | 13.57 | 23.22 | 20.82 | 10.86 | 8.1 |
| 2007 | 73.79 | 48.86 | 26.97 | 31.5 | 19.16 | 13.9 | 23.13 | 20.57 | 10.22 | 7.49 |
| 2006 | 68.17 | 44.05 | 23.38 | 30.05 | 16.26 | 10.85 | 21.74 | 19.6 | 10.28 | 7.38 |
| 2005 | 65.76 | 41.81 | 21.11 | 29.64 | 14.03 | 9.43 | 21.25 | 19.05 | 9.63 | 7.11 |
| 2004 | 62.45 | 38.09 | 18.14 | 28.47 | 11.66 | 7.76 | 20.21 | 18.05 | 8.41 | 6.69 |
| 2003 | 56.29 | 35.1 | 15.06 | 27.5 | 9.99 | 6.27 | 19.54 | 17.54 | 7.32 | 5.33 |
| 2002 | 52.75 | 32.54 | 12.75 | 26.49 | 7.86 | 4.21 | 18.84 | 16.54 | 6.82 | 4.75 |
| 2001 | 52.03 | 32.72 | 13.74 | 24.96 | 8.98 | 5.25 | 17.44 | 15.02 | 6.36 | 4.18 |
| 2000 | 49.96 | 30.67 | 12.94 | 23.87 | 8.5 | 4.72 | 16.31 | 14.1 | 6.04 | 3.74 |
| 1999 | 49.04 | 29.04 | 13.2 | 22.43 | 8.56 | 4.9 | 13.95 | 11.73 | 5.76 | 4.2 |
| 1998 | 45.68 | 26.93 | 12.35 | 20.47 | 8.44 | 5.33 | 13.15 | 10.84 | 5.37 | 3.9 |
| 1997 | 40.98 | 23.51 | 9.67 | 19.08 | 6.36 | 3.2 | 12.12 | 10.04 | 4.66 | 3.36 |
| 1996 | 41.05 | 23.96 | 10.54 | 18.3 | 7.36 | 4.18 | 11.57 | 9.64 | 4.35 | 3.08 |
| 1995 | 39.81 | 23.49 | 10.27 | 17.01 | 7.16 | 4.08 | 10.53 | 8.2 | 4.05 | 2.89 |
| 1994 | 36.44 | 20.81 | 10.01 | 15.01 | 7.03 | 4.04 | 9.36 | 7.63 | 4.04 | 2.82 |
| 1993 | 34.8 | 19.35 | 9.9 | 13.48 | 6.8 | 4.01 | 8.53 | 6.53 | 4.15 | 2.97 |
| 1992 | 34.02 | 18.72 | 10.03 | 12.84 | 6.62 | 3.49 | 7.72 | 5.43 | 3.97 | 2.71 |
| 1991 | 32.03 | 16.55 | 8.12 | 13.41 | 6.42 | 3.58 | 7.06 | 5.14 | 3.88 | 2.82 |
| 1990 | 30.1 | 15.3 | 7.18 | 13.31 | 5.36 | 3.23 | 6.84 | 5.03 | 2.99 | 2.09 |
| 1989 | 28.87 | 14.22 | 6.43 | 12.88 | 4.68 | 3.07 | 6.73 | 4.82 | 2.81 | 1.88 |
| 1988 | 28.9 | 14.21 | 6.69 | 12.95 | 4.79 | 3.35 | 6.67 | 4.82 | 2.79 | 1.97 |
| 1987 | 28.37 | 13.77 | 6.39 | 12.68 | 4.39 | 2.7 | 6.63 | 4.73 | 2.78 | 2.01 |
| 1986 | 27.45 | 13.19 | 6.15 | 12.42 | 4.07 | 2.53 | 6.33 | 4.63 | 2.82 | 2.06 |
| 1985 | 26.8 | 13.34 | 6.13 | 11.47 | 4.28 | 2.86 | 6.37 | 4.53 | 2.58 | 1.87 |
| 1984 | 25.68 | 12.32 | 6.39 | 10.73 | 4.62 | 3.1 | 5.37 | 4.04 | 2.44 | 1.81 |
| 1983 | 24.37 | 12.08 | 5.78 | 10.34 | 4.15 | 2.7 | 5.78 | 4.02 | 2.49 | 1.78 |
| 1982 | 24.63 | 11.94 | 5.61 | 10.33 | 4.04 | 2.43 | 5.78 | 4.04 | 2.36 | 1.66 |
| 1981 | 23 | 11.23 | 5.36 | 9.82 | 3.93 | 2.65 | 5.13 | 3.77 | 2.15 | 1.57 |
| 1980 | 22 | 10.57 | 5.31 | 9.22 | 3.78 | 2.5 | 4.74 | 3.28 | 2.32 | 1.6 |
| 1979 | 22.58 | 10.83 | 4.97 | 9.53 | 3.61 | 2.5 | 5.15 | 3.47 | 2.13 | 1.5 |
| 1978 | 21.86 | 10.1 | 4.69 | 9.17 | 3.24 | 2.2 | 4.85 | 3.54 | 2.04 | 1.45 |
| 1977 | 21 | 9.84 | 4.71 | 8.38 | 3.15 | 2.23 | 4.75 | 3.35 | 2.13 | 1.58 |
| 1976 | 19.08 | 8.93 | 4.24 | 8.02 | 2.82 | 1.95 | 4.43 | 3.16 | 2.07 | 1.53 |
| 1975 | 18.35 | 8.86 | 4.28 | 7.62 | 2.93 | 2.1 | 4.3 | 3.16 | 1.87 | 1.37 |
| 1974 | 18.79 | 8.72 | 4.19 | 7.69 | 2.75 | 2 | 4.24 | 3.07 | 1.91 | 1.42 |
| 1973 | 17.83 | 8.43 | 3.89 | 7.52 | 2.68 | 1.98 | 4.14 | 3.03 | 1.62 | 1.16 |
| 1972 | 16.79 | 8.11 | 3.77 | 6.68 | 2.63 | 1.92 | 4.02 | 2.78 | 1.64 | 1.06 |
| 1971 | 17.17 | 8.19 | 3.81 | 6.86 | 2.62 | 1.9 | 4.2 | 3.05 | 1.76 | 1.17 |
| 1970 | 16.4 | 7.81 | 3.53 | 6.55 | 2.51 | 1.8 | 3.8 | 2.73 | 1.61 | 0.99 |
| 1969 | 16.82 | 8.81 | 3.55 | 7.22 | 2.45 | 1.75 | 5.1 | 3.88 | 1.62 | 1.08 |
| 1968 | 16.13 | 8.27 | 3.27 | 6.87 | 2.33 | 1.7 | 4.84 | 3.73 | 1.48 | 0.91 |
| 1967 | 15.91 | 7.85 | 3.34 | 6.59 | 2.24 | 1.63 | 4.44 | 3.42 | 1.62 | 1.05 |
| 1966 | 15.02 | 7.41 | 3.03 | 6.41 | 1.89 | 1.35 | 4.47 | 3.37 | 1.59 | 1.11 |
| 1965 | 14.61 | 7.25 | 2.95 | 6.13 | 1.8 | 1.32 | 4.34 | 3.42 | 1.56 | 1.09 |
| 1964 | 14.36 | 7.17 | 2.85 | 6.04 | 1.72 | 1.29 | 4.32 | 3.29 | 1.48 | 1.05 |
| 1963 | 14.22 | 7.14 | 2.82 | 6.22 | 1.68 | 1.26 | 4.34 | 3.69 | 1.41 | 1.03 |
| 1962 | 14.01 | 7.51 | 2.65 | 6.49 | 1.61 | 1.23 | 4.87 | 4.12 | 1.25 | 0.94 |
| 1961 | 13.91 | 7.4 | 2.49 | 6.73 | 1.58 | 1.2 | 4.89 | 4.21 | 1.14 | 0.86 |

Comments