
Abstract
Roots and tuber production in global agriculture is an important sector of agriculture. It is shown that China will be the largest producer in 2022. This reflects China’s large agricultural industry and the high demand for agricultural products in the country. However, not only China but also other countries play an important role in roots and tubers production. In particular, countries such as India, the United States, and Brazil boast large production volumes. This trend is based on the climatic conditions and soil suitability of the region, for example, potatoes and sweet potatoes are important cultivated crops in the United States, and yams and cassava are important cultivated crops in Brazil. In addition, there have been increasing efforts in sustainability and production efficiency in recent years, and it is expected that production will increase and quality will improve as technological innovation and agricultural modernization progress. Considering these factors, it is suggested that efforts toward building an agricultural system that emphasizes diversity and sustainability are important for global roots and tuber production.
Rhizome and tuber production (Worldwide)
Looking at data on global root and tuber production over the past few decades, it is clear that China has a notable influence. The staggering figure of 190Mt recorded in 2000 reinforced that position. Subsequent data shows that China’s production has declined from its peak, which is due to a number of factors. One is changes in land use, such as the decline of agricultural land and increased urbanization. In addition, changes in economic structure and changes in consumer eating habits may also be contributing factors. Countries other than China also play an important role in production, but due to China’s large influence, any changes will have a significant impact on global trends. In light of these changes, regional agricultural policies, technological innovation, and the promotion of sustainable agriculture will be important for global root and tuber production.
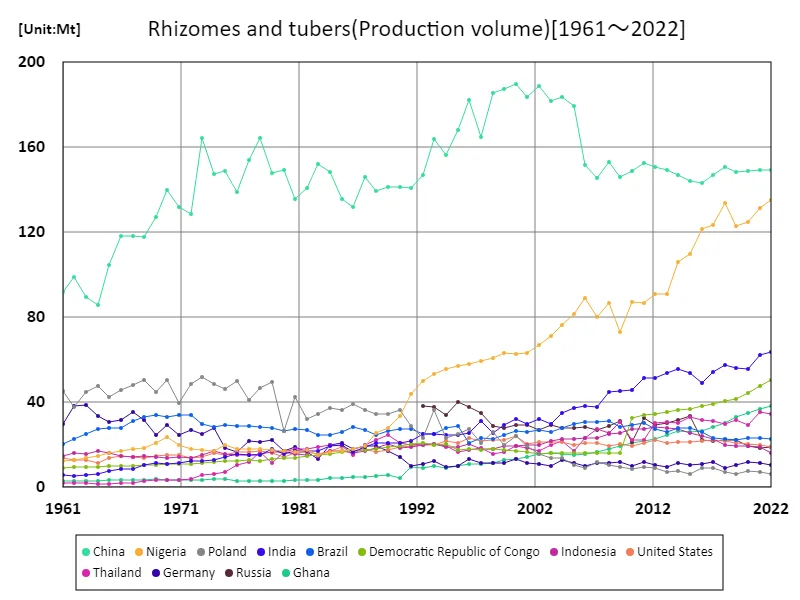
The maximum is 190Mt[2000] of China, and the current value is about 78.7%
Rhizome and tuber production by country (latest year)
It is clear that China is the largest producer of roots and tubers in global agriculture. In 2022, production will be 150Mt, with an overall average of 4.68Mt and a total of 908Mt. This data shows that roots and tubers play an important role in global agriculture. These crops are easily adapted to different climatic conditions and soils around the world, contributing to food security. China’s largest overall production also highlights the size and importance of China’s agricultural industry. However, other countries also play an important role in roots and tubers production, meeting the demand across the world. This trend promotes diversity and stability in the global food system. In the future, roots and tubers production may further increase with the promotion of sustainable agriculture and technological innovation. Such efforts will play an important role in ensuring the world’s food supply.
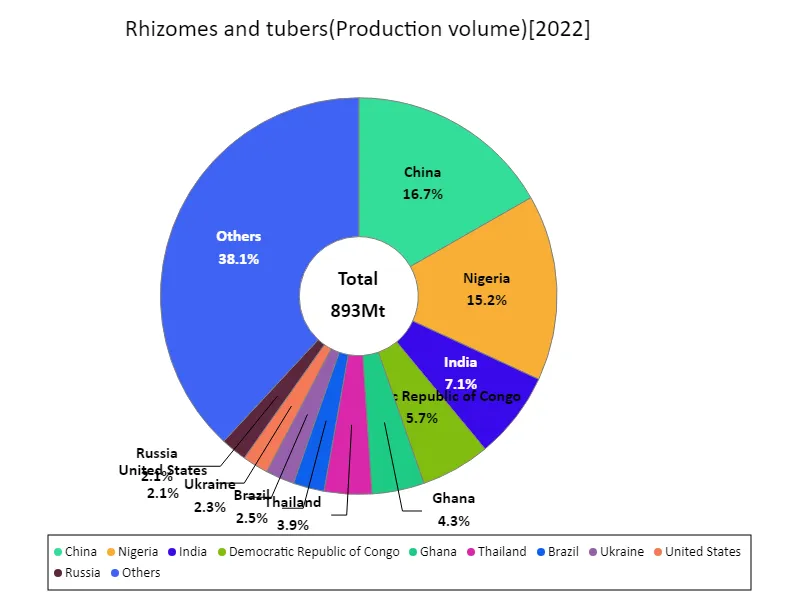
The maximum is 150Mt of China, the average is 4.63Mt, and the total is 893Mt
Rhizome and tuber production (continental)
Roots and tuber production in global agriculture in 2022 will reach a new record high, with Africa leading the way with 368Mt. This data makes it clear that the African continent plays a key role in global roots and tuber production. This increase is likely due to agricultural development and technological advances across Africa, as well as the spread of sustainable agricultural practices. Regional characteristics in Africa, such as climatic conditions and soil suitability, also contribute to the increase in production. Meanwhile, roots and tuber production plays an important role in other regions, but Africa’s rapid increase is noteworthy. This trend indicates that Africa is playing an increasingly important role in the world’s food supply. Going forward, it is expected that the promotion of sustainable agriculture in each region, including Africa, will lead to further increases in production. This could lead to increased global food security and improved livelihoods for rural communities.
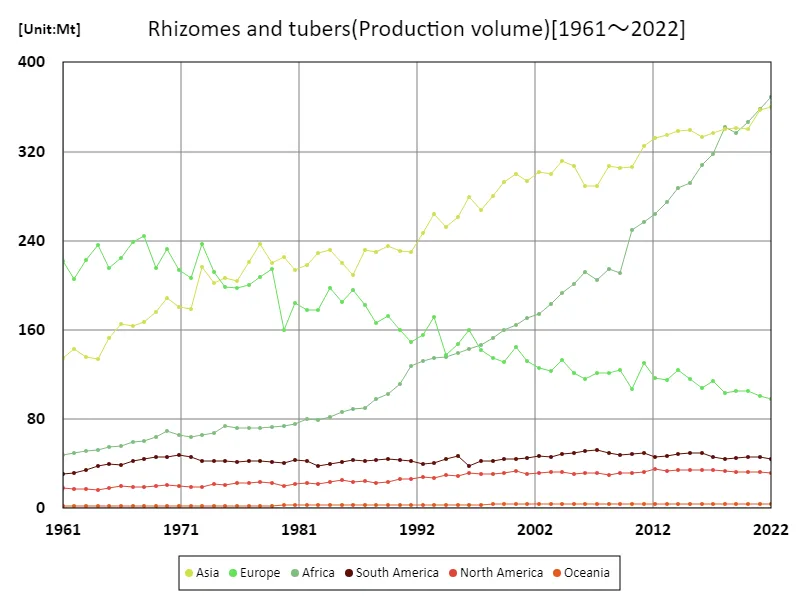
The maximum is the latest one, 368Mt of Africa
Root and tuber production (latest year, continental)
Africa recorded the highest overall production of agricultural roots and tubers in 2022 at 368Mt. The data shows that Africa is playing an increasingly important role in global roots and tubers production. Africa’s increase is due to the development of agriculture and technological advances in the region, as well as the spread of sustainable agricultural practices. Meanwhile, production remains stable in other regions, with an overall average of 151Mt. This shows that roots and tubers are an important food source around the world. Large countries such as China and India also have high production and play an important role in the world’s food supply. Global production also reached a total of 907Mt. This figure highlights that roots and tubers are a very important part of global agriculture. Going forward, it is expected that the promotion of sustainable agriculture and technological innovation will lead to further production increases. This could increase global food security and improve the livelihoods of rural communities.
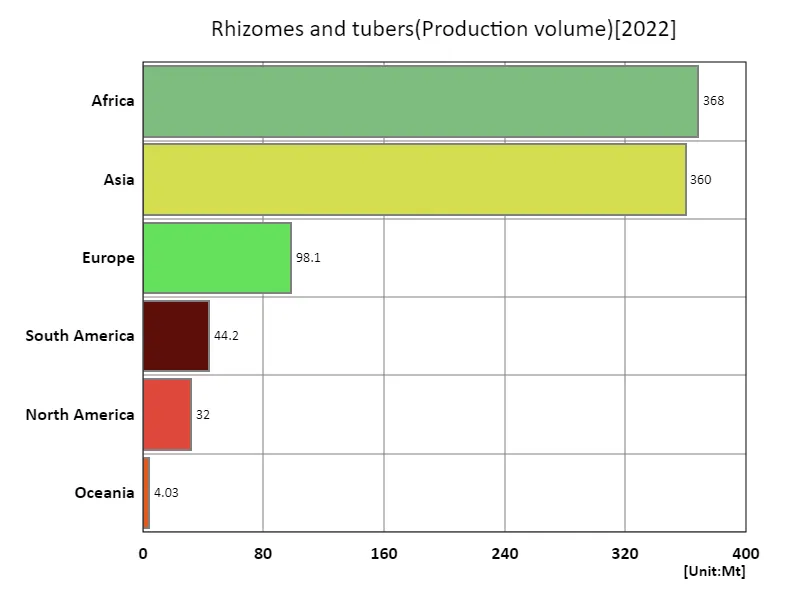
The maximum is 368Mt of Africa, the average is 151Mt, and the total is 907Mt
Main data
| Production(Rhizomes and tubers, Production volume, t) [Mt] | ||||||||||
|---|---|---|---|---|---|---|---|---|---|---|
| World | Lower-middle-income countries | Africa | Asia | Upper-middle-income countries | Net Food Importing Developing Countries | Western Africa | Least Developed Countries | Low Income Food Deficit Countries | Eastern Asia | |
| 2022 | 906.85 | 423.39 | 368.5 | 360.04 | 287.7 | 240.99 | 208.96 | 192.81 | 159.87 | 154.94 |
| 2021 | 899.92 | 411.25 | 358.36 | 357.42 | 291.94 | 230.95 | 204.31 | 184.87 | 154.88 | 154.89 |
| 2020 | 874.09 | 391.28 | 346.45 | 339.98 | 287.95 | 221.12 | 194.26 | 176.06 | 150.17 | 154.66 |
| 2019 | 864.98 | 385.02 | 336.42 | 340.86 | 291.18 | 214.39 | 187.67 | 170.49 | 146.68 | 154.32 |
| 2018 | 868 | 393.12 | 341.53 | 340.6 | 290.56 | 210.82 | 194.84 | 168.15 | 144.41 | 156.17 |
| 2017 | 852.29 | 370.67 | 317.7 | 336.78 | 292.07 | 197.66 | 182.34 | 157.74 | 133.24 | 152.47 |
| 2016 | 835.92 | 359.46 | 307.6 | 332.68 | 294.92 | 192.74 | 177.42 | 154.39 | 130.6 | 149.17 |
| 2015 | 835.09 | 348.67 | 291.42 | 339.64 | 310.14 | 188.1 | 163.69 | 147.93 | 128.35 | 150.67 |
| 2014 | 836.03 | 342.85 | 286.83 | 338.06 | 308.89 | 182.83 | 160.45 | 146.55 | 128.96 | 153.59 |
| 2013 | 809.36 | 321.86 | 274.77 | 334.39 | 309.39 | 183.58 | 140.31 | 148.44 | 128.42 | 156.77 |
| 2012 | 797.87 | 309.47 | 263.81 | 331.92 | 310.83 | 173.02 | 137.8 | 137.78 | 125.21 | 157.71 |
| 2011 | 798.31 | 307.21 | 256.86 | 324.85 | 310.14 | 171.85 | 132.18 | 138.19 | 119.49 | 159.65 |
| 2010 | 746.79 | 283.87 | 249.33 | 306.09 | 293.2 | 160.56 | 130.63 | 128.52 | 114.43 | 155.47 |
| 2009 | 723.39 | 260.9 | 211.27 | 305.04 | 305.75 | 134.38 | 114.67 | 103.08 | 93.72 | 153.08 |
| 2008 | 727.83 | 270.3 | 214.97 | 307.41 | 307.6 | 126.56 | 126.8 | 94.71 | 87.29 | 160.29 |
| 2007 | 702.73 | 243.11 | 204.85 | 288.63 | 301.12 | 122.25 | 115.65 | 93.27 | 87.74 | 153.22 |
| 2006 | 703.64 | 250.14 | 211.84 | 288.65 | 302.83 | 119.86 | 123.02 | 91.94 | 87.43 | 159.12 |
| 2005 | 714.45 | 239.5 | 201.48 | 307.17 | 321.82 | 115.89 | 114.79 | 87.2 | 84.58 | 187.16 |
| 2004 | 722.55 | 226.24 | 193.34 | 311.13 | 331.33 | 112.19 | 110.19 | 86.18 | 83.17 | 191.31 |
| 2003 | 687.96 | 207.17 | 182.91 | 299.48 | 324.53 | 105.69 | 105.35 | 80.51 | 79.44 | 189.11 |
| 2002 | 684.46 | 201.58 | 173.98 | 302.06 | 323.53 | 100.87 | 99.28 | 76.77 | 76.26 | 196.89 |
| 2001 | 675.57 | 189.11 | 170.47 | 293.98 | 320.91 | 102.27 | 92.8 | 78.84 | 79.74 | 191.85 |
| 2000 | 689.79 | 188.69 | 164.69 | 299.76 | 325.21 | 97.9 | 90.93 | 75.01 | 76.19 | 197.63 |
| 1999 | 663.09 | 177.16 | 160.3 | 292.69 | 319.02 | 93.04 | 90.42 | 69.83 | 72.57 | 195.19 |
| 1998 | 643.91 | 168.11 | 152.5 | 279.81 | 312.21 | 86.46 | 86.21 | 65.15 | 67.8 | 192.83 |
| 1997 | 630.95 | 171.98 | 146.18 | 267.21 | 298.94 | 81.68 | 83.65 | 61.42 | 64.19 | 172.1 |
| 1996 | 656.03 | 165.59 | 142.69 | 279.51 | 320.65 | 79.57 | 80.4 | 59.26 | 61.14 | 188.55 |
| 1995 | 627.03 | 158.1 | 138.93 | 261.57 | 313.27 | 77.47 | 78.17 | 58.01 | 59.46 | 174.87 |
| 1994 | 603.22 | 155.99 | 136.07 | 252.56 | 293.46 | 76.85 | 75.2 | 59.9 | 61.37 | 163.07 |
| 1993 | 641.27 | 158.97 | 134.73 | 263.82 | 308.02 | 76.34 | 73.51 | 59.9 | 61.35 | 170.43 |
| 1992 | 605.09 | 154.18 | 132.27 | 247.04 | 289.26 | 77.69 | 69.36 | 61.68 | 63.35 | 154.73 |
| 1991 | 578.92 | 123.08 | 127.8 | 230.29 | 300.04 | 78.74 | 63.51 | 61.94 | 63.58 | 147.97 |
| 1990 | 574.11 | 105.42 | 111.29 | 230.58 | 300.38 | 77.63 | 47.66 | 61.77 | 63.63 | 148.91 |
| 1989 | 581.22 | 98.97 | 102.93 | 235.31 | 315.16 | 74.54 | 42.84 | 58.29 | 59.49 | 149.3 |
| 1988 | 562.52 | 95.26 | 98.14 | 229.71 | 298.64 | 73.76 | 39.7 | 57.35 | 57.97 | 147.45 |
| 1987 | 573.58 | 86.75 | 89.82 | 231.36 | 313.88 | 70.82 | 32.51 | 55.26 | 56.4 | 154.37 |
| 1986 | 564.19 | 83.77 | 89.13 | 209.6 | 307.27 | 71.43 | 31.46 | 56.29 | 57.72 | 140.58 |
| 1985 | 561.31 | 84.34 | 86 | 220.01 | 298.84 | 70.11 | 29.37 | 54.94 | 56.26 | 143.87 |
| 1984 | 578.27 | 80.87 | 82.02 | 232 | 323.2 | 67.18 | 29.13 | 53.1 | 53.52 | 156.26 |
| 1983 | 549.63 | 74.76 | 79.6 | 229.32 | 319.04 | 66.96 | 25.96 | 53.04 | 54.08 | 160.09 |
| 1982 | 543.82 | 77.25 | 79.94 | 218.21 | 305.58 | 64.96 | 28.46 | 50.96 | 52.02 | 149.15 |
| 1981 | 540.86 | 75.29 | 75.84 | 213.7 | 295.62 | 61.88 | 27.46 | 48.28 | 48.89 | 143.35 |
| 1980 | 522.52 | 73.49 | 73.52 | 225.83 | 299.52 | 59.03 | 27.65 | 45.78 | 46.28 | 157.32 |
| 1979 | 575.01 | 75.86 | 73 | 220.35 | 319.59 | 58.14 | 28.04 | 45.03 | 45.81 | 155.93 |
| 1978 | 585.72 | 72.2 | 72.41 | 237.39 | 335.49 | 56.99 | 28.6 | 44.48 | 45.05 | 172.29 |
| 1977 | 561.12 | 69.59 | 72.43 | 220.78 | 318.09 | 56.59 | 27.74 | 44.54 | 45.39 | 162.45 |
| 1976 | 539.96 | 69.21 | 72.05 | 203.41 | 301.51 | 56.02 | 28.47 | 44.03 | 44.79 | 147.48 |
| 1975 | 544.49 | 68.32 | 73.91 | 206.49 | 310.8 | 55.22 | 30.32 | 43.39 | 44.35 | 157.22 |
| 1974 | 548.55 | 61.99 | 67.96 | 202.44 | 302.51 | 51.29 | 27.7 | 40.06 | 41.04 | 154.94 |
| 1973 | 583.38 | 60.15 | 65.76 | 216.62 | 344.6 | 49.2 | 27.71 | 38.37 | 38.83 | 172.75 |
| 1972 | 516.14 | 58.5 | 64.11 | 178.56 | 279.74 | 47.4 | 27.14 | 37.34 | 37.73 | 138.01 |
| 1971 | 529.29 | 59.41 | 65.37 | 180.64 | 297.87 | 47.11 | 29.54 | 36.98 | 36.87 | 141.34 |
| 1970 | 559.61 | 62.47 | 69.38 | 188.22 | 308.62 | 47.09 | 33.24 | 37.07 | 36.98 | 150.01 |
| 1969 | 524.56 | 59.84 | 63.63 | 176.48 | 291.31 | 44.3 | 30.45 | 34.48 | 34.18 | 137.59 |
| 1968 | 537.32 | 56.4 | 60.26 | 166.91 | 291.49 | 42.45 | 27.96 | 33.35 | 33.44 | 129.22 |
| 1967 | 525.16 | 53.29 | 59.07 | 163.58 | 281.19 | 41.82 | 27.44 | 32.77 | 32.99 | 129.44 |
| 1966 | 506.44 | 50.64 | 55.98 | 165.42 | 270.87 | 39.77 | 25.84 | 30.99 | 31.38 | 131.37 |
| 1965 | 484 | 48.38 | 55.2 | 152.92 | 257.02 | 40.03 | 24.47 | 31.22 | 31.75 | 118.5 |
| 1964 | 478.57 | 45.06 | 52.39 | 134.09 | 246.78 | 38.23 | 23.03 | 29.68 | 30.42 | 100.19 |
| 1963 | 463.43 | 43.73 | 51.41 | 135.31 | 224.45 | 37.47 | 22 | 29.45 | 30.34 | 102.93 |
| 1962 | 448.86 | 40.86 | 49.58 | 142.98 | 225.93 | 36.99 | 20.67 | 29.18 | 30 | 111.65 |
| 1961 | 455.31 | 40.52 | 48.02 | 135.07 | 230.45 | 36.01 | 19.96 | 28.48 | 29.24 | 104.97 |

Comments