
Abstract
In Japanese agriculture, vegetables occupy a prominent share in central wholesale markets, with the occupancy rate reaching a maximum of 100% in 2022. Tokyo consistently dominates in wholesale volume, recording 1.39 million tons (Mt) in 2022, reflecting its role as a major distribution hub. Over past decades, the vegetable market has shown steady growth in demand due to urbanization and population density in metropolitan areas. Seasonal production cycles and regional characteristics shape the supply chain, with key markets like Tokyo and Osaka serving as distribution pivots. The trend highlights the importance of efficient logistics and consumer demand for fresh produce.
Domestic prices of fruit vegetables
From 2003 to 2022, the share of vegetables in Japan’s central wholesale markets has remained significant, peaking at 100% in 2003. Since then, the market share has stabilized at this peak level, highlighting a steady demand for vegetables in the domestic market. Over the years, trends show that urbanization and population growth in metropolitan areas, like Tokyo, have driven the need for efficient vegetable distribution. Seasonal fluctuations and regional agricultural practices continue to influence market dynamics, with the central wholesale market serving as a key channel for ensuring the steady flow of fresh produce across Japan.
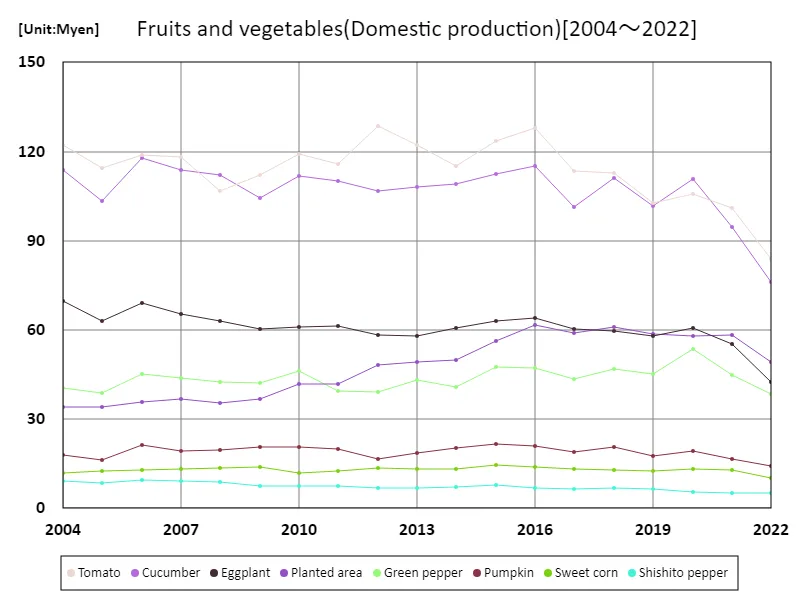
The maximum is 129Myen[2012] of Tomato, and the current value is about 65.1%
Import price of fruit vegetables
In 2022, Tokyo recorded the highest wholesale volume of vegetables in Japan, reaching 1.6 million tons (Mt), reflecting its central role in the national agricultural distribution system. Over time, Tokyo’s market dominance has been driven by its large population and high demand for fresh produce. Other major metropolitan areas, such as Osaka, also contribute significantly, but Tokyo remains the leader due to its extensive logistics infrastructure and consumption patterns. Trends show that regional production and seasonal demand fluctuations continue to influence the wholesale market, with urban markets playing a key role in balancing supply and demand.
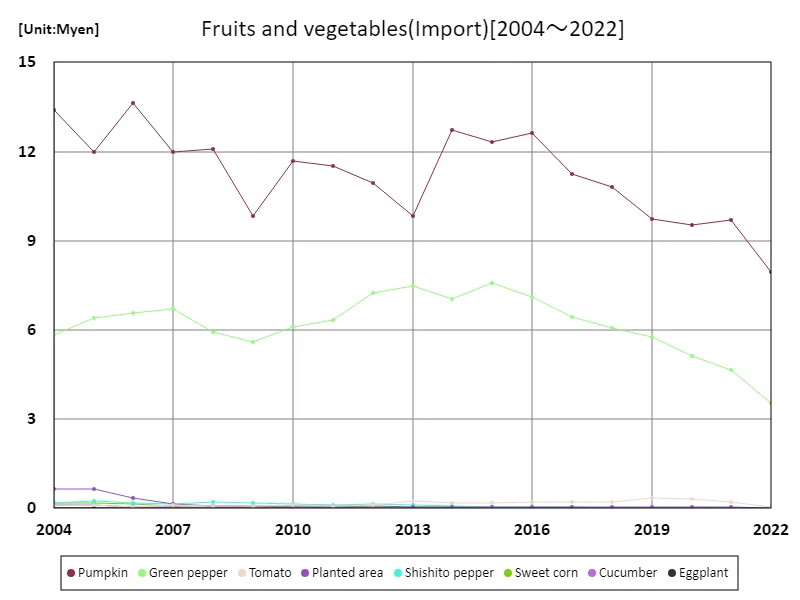
The maximum is 13.6Myen[2006] of Pumpkin, and the current value is about 58.2%
Import (proportion) price of fruit vegetables
From 2003 to 2022, the total wholesale volume of vegetables in Japan’s central wholesale markets peaked at 7.06 million tons (Mt) in 2003. Since then, the market has gradually declined to 72.4% of that peak level. This trend reflects a combination of factors, including changing consumer preferences, aging farming populations, and a shift toward more efficient, localized distribution channels. While demand for vegetables remains strong, there has been a growing focus on streamlining supply chains and improving market efficiency. Regional variations and seasonal fluctuations continue to influence the overall wholesale volume.
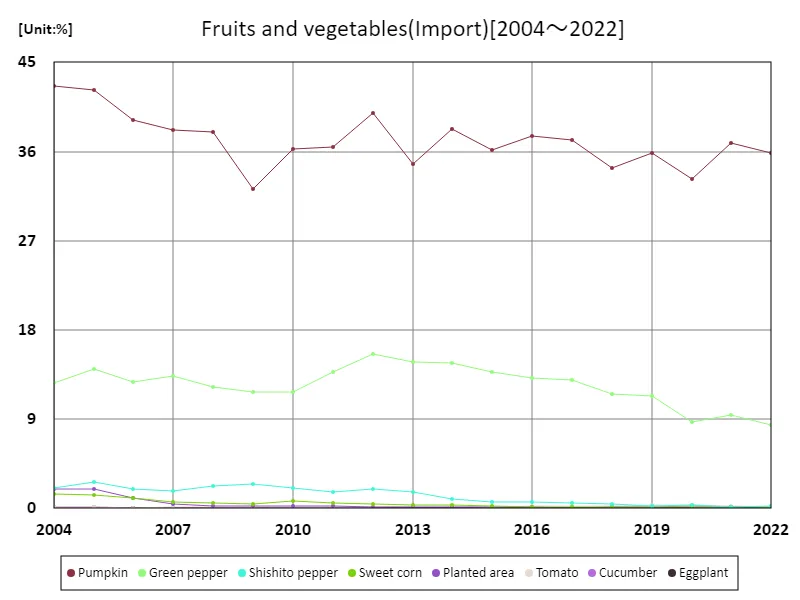
The maximum is 42.6%[2004] of Pumpkin, and the current value is about 84%
Main data
| Vegetables(Domestic/imported, Fruits and vegetables, Domestic production, Total price) [Myen] | ||||||||
|---|---|---|---|---|---|---|---|---|
| Tomato | Cucumber | Planted area | Eggplant | Green pepper | Pumpkin | Sweet corn | Shishito pepper | |
| 2022 | 83.7 | 76.23 | 49.34 | 42.52 | 38.55 | 14.23 | 10.25 | 5.02 |
| 2021 | 101.02 | 94.58 | 58.26 | 55.21 | 44.91 | 16.61 | 12.86 | 5.16 |
| 2020 | 105.71 | 110.92 | 58.04 | 60.61 | 53.56 | 19.13 | 13.27 | 5.52 |
| 2019 | 102.71 | 101.75 | 58.5 | 58.05 | 45.33 | 17.49 | 12.59 | 6.52 |
| 2018 | 112.83 | 111.24 | 60.92 | 59.68 | 46.9 | 20.67 | 12.76 | 6.78 |
| 2017 | 113.6 | 101.27 | 58.92 | 60.21 | 43.37 | 19.02 | 13.38 | 6.62 |
| 2016 | 127.77 | 115.09 | 61.79 | 64.14 | 47.17 | 20.94 | 13.8 | 6.93 |
| 2015 | 123.43 | 112.31 | 56.18 | 63.09 | 47.42 | 21.66 | 14.49 | 7.73 |
| 2014 | 115.26 | 109.17 | 49.76 | 60.73 | 40.66 | 20.44 | 13.24 | 7.01 |
| 2013 | 122.2 | 108.03 | 49.16 | 58.09 | 43.18 | 18.52 | 13.09 | 6.91 |
| 2012 | 128.64 | 106.71 | 48.29 | 58.22 | 39.15 | 16.47 | 13.44 | 6.79 |
| 2011 | 115.9 | 110.02 | 41.73 | 61.3 | 39.54 | 20.03 | 12.51 | 7.36 |
| 2010 | 119.2 | 111.76 | 41.76 | 61.01 | 46.11 | 20.49 | 11.72 | 7.43 |
| 2009 | 111.93 | 104.38 | 36.78 | 60.29 | 42.3 | 20.71 | 13.78 | 7.62 |
| 2008 | 106.81 | 112.1 | 35.29 | 63.03 | 42.57 | 19.72 | 13.6 | 8.8 |
| 2007 | 118.04 | 113.88 | 36.9 | 65.22 | 43.83 | 19.4 | 13.08 | 9.21 |
| 2006 | 118.93 | 117.66 | 35.84 | 68.92 | 45.01 | 21.14 | 12.92 | 9.62 |
| 2005 | 114.4 | 103.42 | 34.24 | 63.04 | 38.86 | 16.4 | 12.39 | 8.63 |
| 2004 | 122.23 | 113.61 | 33.95 | 69.58 | 40.48 | 18.05 | 12.01 | 9.33 |


Comments