Abstract
In recent years, Japan’s daikon radish production has shown steady growth. The 2022 harvest reached a peak of 1.18 million tons (Mt), marking the highest national yield to date. This was supported by a cultivated area of 28.1 thousand hectares (kha), the largest in history. Over the years, Chiba Prefecture has been the leader in shipping, with 135,000 tons (kt) shipped in 2022, reflecting its dominant role in daikon production. Trends indicate a consistent increase in yield and cultivated area, highlighting the importance of daikon in Japan’s agricultural landscape.
Chinese cabbage harvest volume (main data).
Daikon radish production in Japan has experienced significant changes since its peak in 1977, when the nationwide harvest reached 2.76 million tons (Mt). As of 2022, production stands at 42.8% of that peak, highlighting a notable decline over the decades. This decrease reflects shifts in agricultural practices, land use, and consumer demand. Despite fluctuations, daikon remains a staple in Japanese cuisine, and efforts to maintain or increase yields continue. Regional variations, such as Chiba’s dominant shipping volumes, demonstrate the ongoing importance of specific areas in sustaining production.
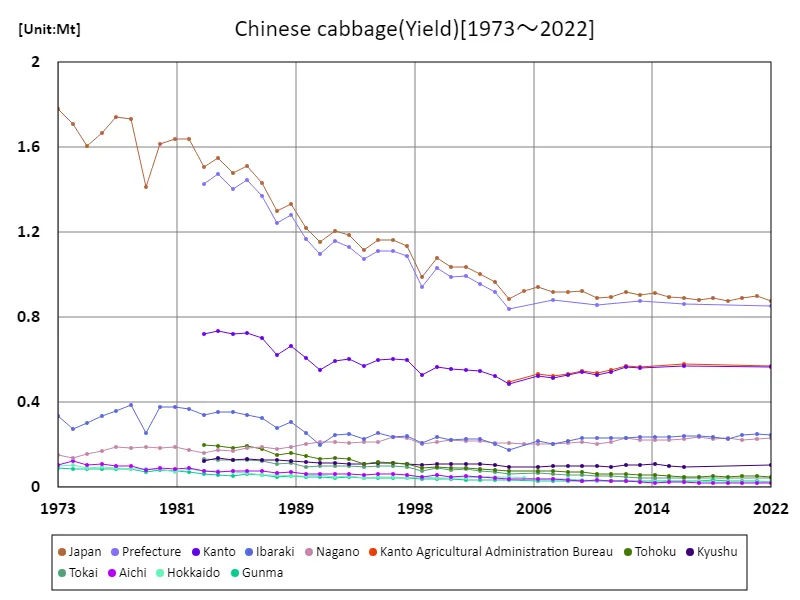
The maximum is 1.78Mt[1973] of Japan, and the current value is about 49.2%
Chinese cabbage harvest volume (by prefecture).
As of 2022, Chiba Prefecture leads Japan in root vegetable production, with a maximum yield of 145,000 tons (kt), the highest recorded value. Over time, Chiba has maintained its position as the top producer, reflecting its favorable climate and farming techniques. Nationally, root vegetable yields have seen fluctuations, but Chiba’s consistent output demonstrates its significant role in Japan’s agriculture. This trend highlights the concentration of production in key regions, with Chiba continuing to drive the bulk of root vegetable shipments, particularly in daikon and other staples.
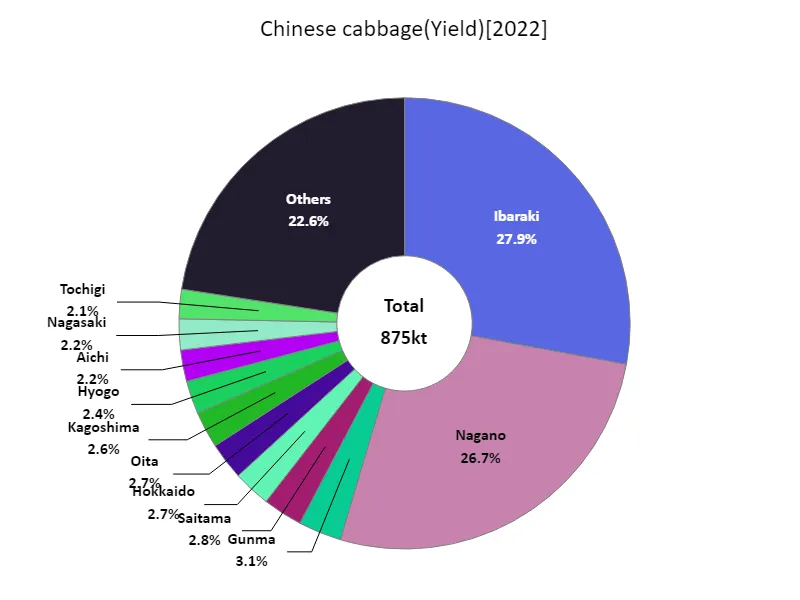
The maximum is 244kt of Ibaraki, the average is 18.6kt, and the total is 875kt
Area of cabbage cultivation (main data).
Since its peak of 76,000 hectares (kha) in 1973, the area allocated for cultivating daikon radishes in Japan has significantly declined. As of 2022, the cultivated area stands at just 37% of its historical maximum. This reduction reflects broader changes in agricultural land use, shifts toward other crops, and a decrease in demand for certain vegetables. Despite this, daikon remains a key part of Japanese cuisine, with efforts to optimize cultivation methods and maintain regional production, especially in areas like Chiba, where the crop continues to thrive.
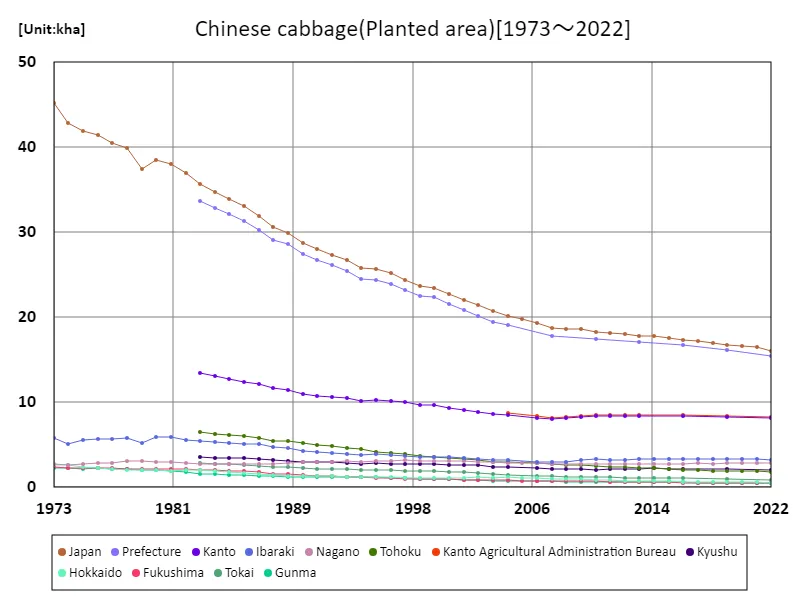
The maximum is 45.2kha[1973] of Japan, and the current value is about 35.4%
Area of Chinese cabbage cultivation (by prefecture).
As of 2022, Hokkaido leads Japan in the area allocated for growing root vegetables, with a cultivated area of 2.78 thousand hectares (kha), the largest in the country. This dominance reflects Hokkaido’s favorable climate and vast agricultural land, making it a key region for root vegetable production. Over time, the prefecture has consistently maintained its position as the top producer. While other regions have seen fluctuations in land use for root crops, Hokkaido remains a central hub, supporting national supply, particularly for daikon and other root vegetables.
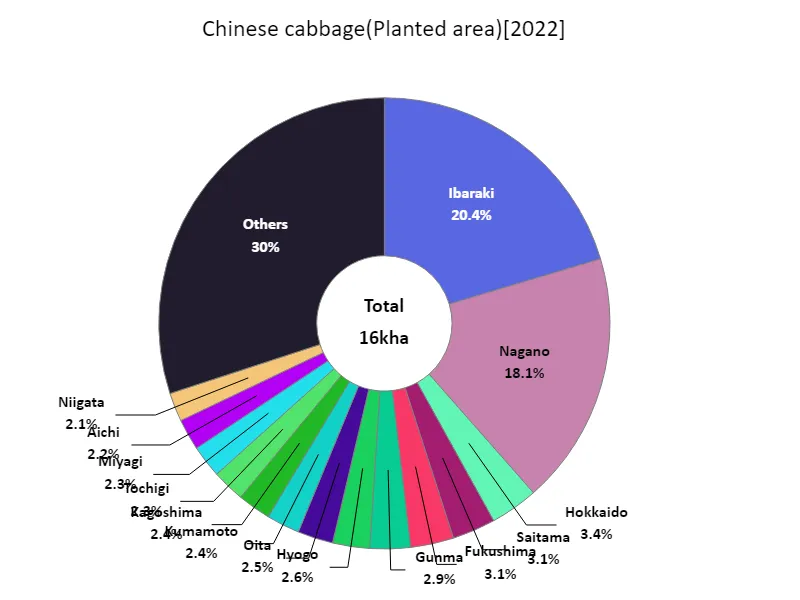
The maximum is 3.27kha of Ibaraki, the average is 341ha, and the total is 16kha
The volume of Chinese cabbage shipped.
In 2022, Chiba Prefecture led Japan in daikon radish shipping, with a maximum volume of 135,000 tons (kt), reflecting its central role in national production. The average shipping volume nationwide was 21,000 tons, contributing to a total of 987,000 tons. This trend highlights Chiba’s continued dominance, driven by its favorable farming conditions and efficient distribution networks. Over the years, while other regions contribute to the overall supply, Chiba’s significant share underscores its importance in maintaining a stable daikon supply across Japan.
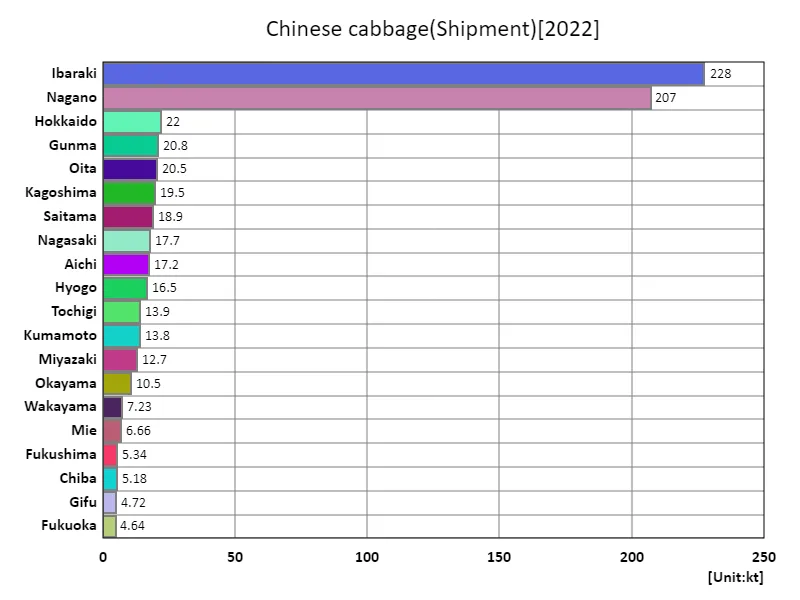
The maximum is 228kt of Ibaraki, the average is 15.5kt, and the total is 728kt
Main data
| Leaf and stem vegetables(Chinese cabbage, Yield) [kt] | ||||||||||
|---|---|---|---|---|---|---|---|---|---|---|
| Japan | Prefecture | Kanto Agricultural Administration Bureau | Kanto | Ibaraki | Nagano | Kyushu | Tohoku | Tokai | Kinki | |
| 2022 | 874.6 | 851.2 | 571.5 | 566.7 | 244.1 | 233.5 | 103.7 | 48.2 | 41.9 | 40.4 |
| 2021 | 899.9 | 250.3 | 228 | 51.9 | ||||||
| 2020 | 892.3 | 243.9 | 224.2 | 52.1 | ||||||
| 2019 | 874.8 | 227.7 | 232.5 | 50.3 | ||||||
| 2018 | 889.9 | 236.2 | 225.8 | 52 | ||||||
| 2017 | 880.9 | 243.7 | 235.2 | 50.7 | ||||||
| 2016 | 888.7 | 864.2 | 578 | 572.6 | 242.4 | 229.3 | 97.5 | 50.1 | 42.3 | 43 |
| 2015 | 894.6 | 236 | 222.3 | 102.1 | 53.7 | 43.5 | 44.8 | |||
| 2014 | 914.4 | 238.3 | 222.4 | 109.1 | 57.8 | 43.7 | 47.2 | |||
| 2013 | 906.3 | 877.6 | 567.2 | 561.3 | 237.4 | 224.2 | 103.3 | 57.5 | 45.7 | 46.5 |
| 2012 | 920.7 | 571.6 | 565.8 | 232.7 | 234.1 | 104.8 | 60.5 | 49.7 | 45.4 | |
| 2011 | 897.4 | 550.4 | 544.6 | 232.8 | 212.9 | 97.6 | 63.1 | 50.9 | 44.7 | |
| 2010 | 888.7 | 859 | 536.7 | 530.1 | 229.8 | 202.7 | 98.2 | 64.8 | 55.2 | 44.6 |
| 2009 | 924.1 | 548.9 | 542.3 | 231.1 | 212.8 | 98.5 | 74.3 | 56.4 | 42.9 | |
| 2008 | 921.4 | 535.1 | 527.7 | 219.2 | 207.2 | 98.7 | 73.7 | 59.7 | 48.2 | |
| 2007 | 917.5 | 879.2 | 521.7 | 513.6 | 205 | 204.6 | 99.4 | 76 | 63 | 51.3 |
| 2006 | 942.3 | 534 | 525.2 | 219.7 | 202.6 | 97.3 | 78.4 | 66.1 | 56.2 | |
| 2005 | 924.3 | 203 | ||||||||
| 2004 | 887.6 | 841.1 | 494.3 | 486.9 | 177.5 | 209.9 | 95.4 | 76.6 | 61 | 49.5 |
| 2003 | 964.5 | 918.3 | 523.2 | 203.1 | 210.7 | 102.7 | 83.7 | 69.9 | 52.9 | |
| 2002 | 1005 | 958.5 | 547.3 | 227.1 | 218.7 | 108 | 84.9 | 78.7 | 54.7 | |
| 2001 | 1038 | 992.4 | 554.3 | 228 | 216.5 | 110.6 | 92 | 84.4 | 59.1 | |
| 2000 | 1036 | 992 | 556.9 | 221.4 | 221.9 | 109.2 | 92.5 | 81.7 | 58.1 | |
| 1999 | 1079 | 1034 | 566.9 | 234.7 | 213.4 | 111.2 | 97.5 | 92.6 | 65.3 | |
| 1998 | 989.9 | 943.2 | 528.8 | 208.9 | 205.4 | 105.5 | 90.4 | 76.5 | 53.7 | |
| 1997 | 1135 | 1089 | 599 | 242.4 | 231.4 | 109.9 | 108.7 | 93.2 | 69.2 | |
| 1996 | 1162 | 1111 | 604.5 | 237.8 | 234.9 | 112.7 | 114.7 | 99.9 | 69.3 | |
| 1995 | 1163 | 1113 | 598.6 | 253.5 | 214 | 112.4 | 117 | 99.9 | 73.3 | |
| 1994 | 1118 | 1073 | 571.7 | 228 | 212 | 110.5 | 110.8 | 94.1 | 73.1 | |
| 1993 | 1185 | 1133 | 601.7 | 250.6 | 210.5 | 109.7 | 132.3 | 99.9 | 72.3 | |
| 1992 | 1205 | 1157 | 595.9 | 244.2 | 215.4 | 115.6 | 136 | 102.2 | 77.2 | |
| 1991 | 1154 | 1098 | 550.8 | 201.4 | 211.6 | 112.6 | 131.2 | 101.7 | 78.5 | |
| 1990 | 1220 | 1167 | 609 | 254.1 | 205.3 | 119.9 | 145.8 | 97 | 74.7 | |
| 1989 | 1334 | 1282 | 662.9 | 305 | 190.7 | 124.3 | 161 | 113.8 | 83.3 | |
| 1988 | 1302 | 1243 | 621.8 | 281.2 | 180.9 | 128.1 | 152.7 | 111 | 86.8 | |
| 1987 | 1432 | 1372 | 703.2 | 323.8 | 191.6 | 129.2 | 181.1 | 122.7 | 88.5 | |
| 1986 | 1513 | 1444 | 725.8 | 339.8 | 184.2 | 134.6 | 192.8 | 128.5 | 105.4 | |
| 1985 | 1478 | 1404 | 720.6 | 352.4 | 168.6 | 129 | 184.7 | 126.3 | 97.8 | |
| 1984 | 1549 | 1474 | 736.2 | 355.7 | 175.5 | 136 | 195.9 | 127.6 | 109.7 | |
| 1983 | 1507 | 1428 | 719.3 | 340.8 | 163.3 | 125.9 | 198 | 131.4 | 95.2 | |
| 1982 | 1638 | 367.7 | 175.9 | |||||||
| 1981 | 1637 | 379.2 | 189 | |||||||
| 1980 | 1616 | 379.9 | 186.2 | |||||||
| 1979 | 1411 | 254.4 | 190.5 | |||||||
| 1978 | 1731 | 388.9 | 185.8 | |||||||
| 1977 | 1743 | 360.7 | 188.5 | |||||||
| 1976 | 1668 | 334.6 | 170.4 | |||||||
| 1975 | 1607 | 304.9 | 155.5 | |||||||
| 1974 | 1712 | 275.6 | 138.5 | |||||||
| 1973 | 1779 | 336.6 | 152.7 | |||||||


Comments