
Abstract
India’s vegetable production has evolved significantly over the years. In 2022, eggplant led with 12.8 million tonnes (Mt), followed by tomatoes at 11.2 Mt. Tomatoes are primarily cultivated by marginal and small farmers, who manage 82.1% of total land holdings.RESERVE BANK OF INDIADespite being the second-largest global producer, India’s average vegetable yield is relatively low at 17 tonnes per hectare, indicating potential for improvement.INDIAN COUNCIL OF AGRICULTURAL RESEARCHThe country’s total agricultural land area is approximately 141 million hectares.アグリウェルフェア情報源
Production (by vegetables)
India’s vegetable production has shown consistent growth over the decades, with eggplant reaching its peak of 13.6 million tonnes (Mt) in 2014. As of 2022, production stands at 94.2% of that peak, reflecting a steady yet gradual decline in growth. Other vegetables, including tomatoes and potatoes, have also experienced fluctuating trends, with varied production peaks. Advances in agricultural practices, though contributing to growth, highlight challenges like land use efficiency and yield improvement. Continued focus on technology and sustainable practices may be key to enhancing future yields and stabilizing production.
The maximum is 21.2Mt[2021] of Production volume, and the current value is about 97.7%
Yield(by vegetable)
India’s vegetable production has seen significant improvements in yield, with tomatoes reaching a peak of 26 tonnes per hectare (t/ha) in 2017. As of 2022, production is at 94.5% of this peak, showing consistent growth. This increase in yield reflects advancements in farming techniques, irrigation, and crop management. However, despite these gains, challenges remain in optimizing land use and addressing regional disparities. Continued investment in technology, better infrastructure, and sustainable practices will be essential for maintaining and improving tomato yields while boosting overall vegetable production.
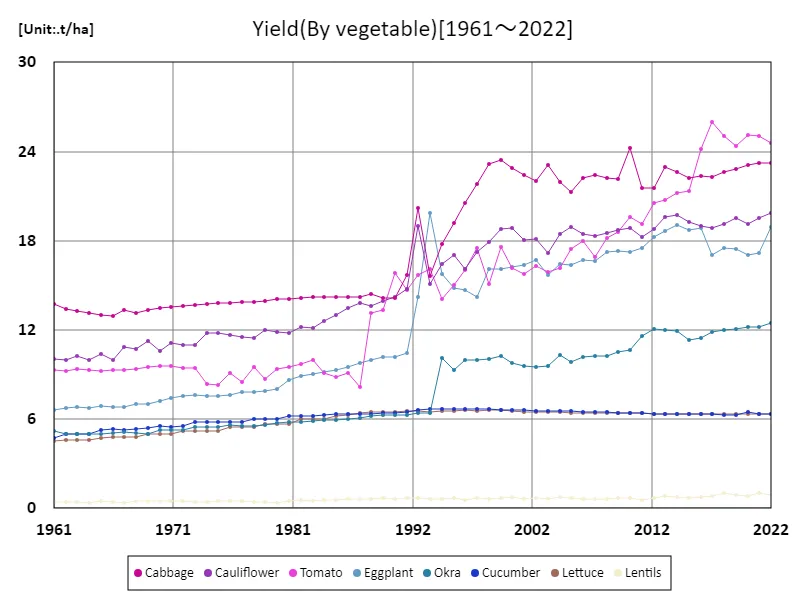
The maximum is 26t/ha[2017] of Tomato, and the current value is about 94.5%
Land use (by vegetables)
In 2022, India’s vegetable production reached a steady total of 20.7 million tonnes (Mt), maintaining its peak level from previous years. This consistency suggests efficient land use and stable agricultural practices across the country. However, challenges like crop rotation, water usage, and regional variations in land productivity continue to influence production. The average production aligns with the maximum, indicating a balanced approach to vegetable farming, though further improvements in land optimization and sustainable practices could enhance yields and address regional disparities for more equitable growth.
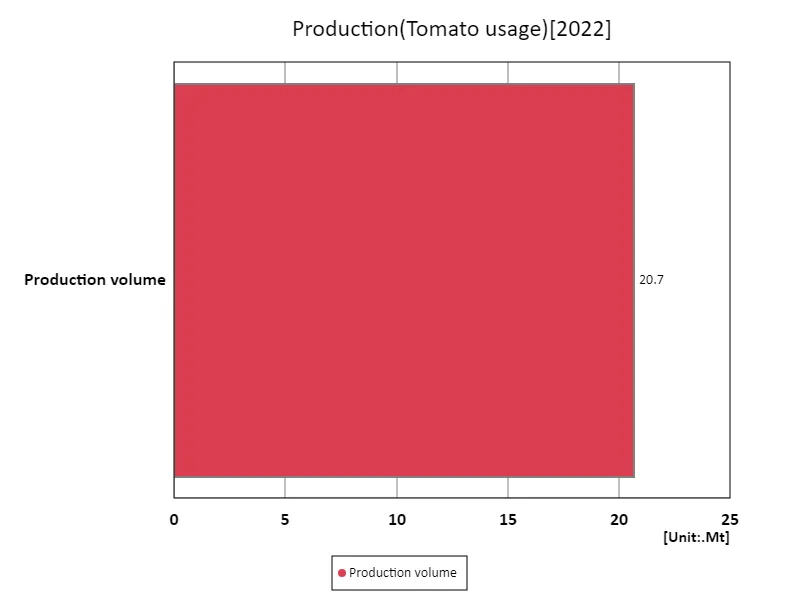
The maximum is 20.7Mt of Production volume, the average is 20.7Mt, and the total is 20.7Mt
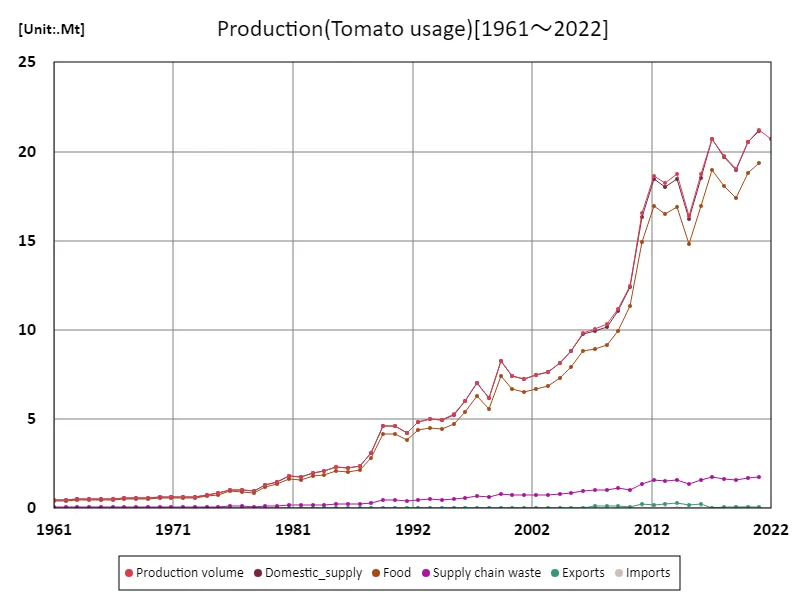
Tomato usage
Since 1961, tomatoes have become a significant part of India’s vegetable production, reaching a record-high 21.2 million tonnes (Mt). This growth reflects advancements in farming techniques, irrigation, and improved crop varieties. The steady increase in production underscores the importance of tomatoes in India’s agricultural landscape, both for domestic consumption and export. However, challenges such as fluctuating weather patterns and land use efficiency persist. Continued innovation in farming practices and better resource management are key to maintaining and further boosting tomato production.

The maximum is 21.2Mt[2021] of Production volume, and the current value is about 97.7%
Main data
| Production(Tomato usage) [Mt] | ||||||
|---|---|---|---|---|---|---|
| Production volume | Domestic_supply | Food | Supply chain waste | Exports | Imports | |
| 2022.0 | 20.69 | |||||
| 2021.0 | 21.18 | 21.12 | 19.35 | 1.77 | 0.09 | 0.03 |
| 2020.0 | 20.55 | 20.52 | 18.79 | 1.72 | 0.1 | 0.06 |
| 2019.0 | 19.01 | 18.98 | 17.39 | 1.59 | 0.08 | 0.05 |
| 2018.0 | 19.76 | 19.71 | 18.06 | 1.66 | 0.07 | 0.02 |
| 2017.0 | 20.71 | 20.69 | 18.95 | 1.73 | 0.04 | 0.01 |
| 2016.0 | 18.73 | 18.5 | 16.93 | 1.57 | 0.25 | 0.02 |
| 2015.0 | 16.39 | 16.21 | 14.84 | 1.37 | 0.19 | 0.02 |
| 2014.0 | 18.74 | 18.46 | 16.89 | 1.57 | 0.3 | 0.02 |
| 2013.0 | 18.23 | 18.01 | 16.48 | 1.53 | 0.23 | 0.02 |
| 2012.0 | 18.65 | 18.49 | 16.92 | 1.56 | 0.17 | 0.02 |
| 2011.0 | 16.53 | 16.31 | 14.93 | 1.38 | 0.23 | 0.02 |
| 2010.0 | 12.43 | 12.4 | 11.36 | 1.04 | 0.07 | 0.02 |
| 2009.0 | 11.15 | 11.05 | 9.94 | 1.12 | 0.11 | 0.01 |
| 2008.0 | 10.3 | 10.19 | 9.16 | 1.03 | 0.13 | 0.01 |
| 2007.0 | 10.06 | 9.94 | 8.93 | 1.01 | 0.14 | 0.02 |
| 2006.0 | 9.82 | 9.8 | 8.82 | 0.98 | 0.03 | 0.01 |
| 2005.0 | 8.83 | 8.82 | 7.94 | 0.88 | 0.01 | 0.01 |
| 2004.0 | 8.13 | 8.12 | 7.31 | 0.81 | 0.01 | 0.01 |
| 2003.0 | 7.62 | 7.61 | 6.85 | 0.76 | 0.01 | 0.01 |
| 2002.0 | 7.46 | 7.45 | 6.71 | 0.75 | 0.01 | 0 |
| 2001.0 | 7.24 | 7.24 | 6.52 | 0.72 | 0 | |
| 2000.0 | 7.43 | 7.43 | 6.69 | 0.74 | 0 | 0 |
| 1999.0 | 8.27 | 8.27 | 7.44 | 0.83 | 0 | |
| 1998.0 | 6.18 | 6.18 | 5.57 | 0.62 | 0 | 0.01 |
| 1997.0 | 7 | 7 | 6.3 | 0.7 | 0 | |
| 1996.0 | 6 | 6 | 5.4 | 0.6 | 0 | |
| 1995.0 | 5.26 | 5.26 | 4.73 | 0.53 | 0 | |
| 1994.0 | 4.93 | 4.93 | 4.44 | 0.49 | 0 | |
| 1993.0 | 5 | 5 | 4.5 | 0.5 | ||
| 1992.0 | 4.85 | 4.85 | 4.36 | 0.49 | ||
| 1991.0 | 4.24 | 4.24 | 3.82 | 0.42 | ||
| 1990.0 | 4.6 | 4.6 | 4.14 | 0.46 | ||
| 1989.0 | 4.6 | 4.6 | 4.14 | 0.46 | ||
| 1988.0 | 3.1 | 3.1 | 2.79 | 0.31 | 0 | |
| 1987.0 | 2.39 | 2.39 | 2.15 | 0.24 | ||
| 1986.0 | 2.28 | 2.28 | 2.05 | 0.23 | ||
| 1985.0 | 2.3 | 2.3 | 2.07 | 0.23 | ||
| 1984.0 | 2.1 | 2.1 | 1.89 | 0.21 | ||
| 1983.0 | 2 | 2 | 1.8 | 0.2 | ||
| 1982.0 | 1.75 | 1.75 | 1.58 | 0.18 | ||
| 1981.0 | 1.8 | 1.8 | 1.62 | 0.18 | ||
| 1980.0 | 1.5 | 1.5 | 1.35 | 0.15 | ||
| 1979.0 | 1.3 | 1.3 | 1.17 | 0.13 | ||
| 1978.0 | 0.95 | 0.95 | 0.86 | 0.1 | ||
| 1977.0 | 1.02 | 1.02 | 0.92 | 0.1 | ||
| 1976.0 | 1.05 | 1.05 | 0.95 | 0.11 | ||
| 1975.0 | 0.83 | 0.83 | 0.75 | 0.08 | ||
| 1974.0 | 0.75 | 0.75 | 0.68 | 0.08 | ||
| 1973.0 | 0.66 | 0.66 | 0.59 | 0.07 | ||
| 1972.0 | 0.65 | 0.65 | 0.59 | 0.07 | ||
| 1971.0 | 0.64 | 0.64 | 0.58 | 0.06 | ||
| 1970.0 | 0.62 | 0.62 | 0.56 | 0.06 | ||
| 1969.0 | 0.6 | 0.6 | 0.54 | 0.06 | ||
| 1968.0 | 0.58 | 0.58 | 0.52 | 0.06 | ||
| 1967.0 | 0.56 | 0.56 | 0.5 | 0.06 | ||
| 1966.0 | 0.54 | 0.54 | 0.49 | 0.05 | ||
| 1965.0 | 0.53 | 0.53 | 0.47 | 0.05 | ||
| 1964.0 | 0.51 | 0.51 | 0.46 | 0.05 | ||
| 1963.0 | 0.5 | 0.5 | 0.45 | 0.05 | ||
| 1962.0 | 0.48 | 0.48 | 0.43 | 0.05 | ||
| 1961.0 | 0.46 | 0.46 | 0.42 | 0.05 | ||


Comments